- 2026
- 2025
- 2024
- 2023
- 2022
- 2021
- 2020
- 2019
- 2018
- 2017
- 2016
- 2015
- 2014
- 2013
- 2012
- 2011
Management Discussion & Analysis (MD&A) Quarter 1/2026
OVERVIEW
Unit : MB
| Q1/2026 | Q1/2025 | Increased (Decreased) |
% YoY |
|
|---|---|---|---|---|
| Revenue from sales | 258.01 | 244.52 | 13.49 | 5.52% |
| Revenue from services | 2.48 | 1.79 | 0.69 | 38.40% |
| Total revenues | 260.48 | 246.31 | 14.18 | 5.76% |
| Cost of sales | (180.81) | (179.20) | 1.61 | 0.90% |
| Cost of services | (1.85) | (1.26) | 0.59 | 47.02% |
| Total costs | (182.66) | (180.46) | 2.20 | 1.22% |
| Gross profit | 77.83 | 65.85 | 11.98 | 18.19% |
| Gross profit margin (%) | 29.88% | 26.74% | 3.14% | |
| Other income | 0.91 | 4.14 | (3.23) | -78.11% |
| Distribution costs | (31.45) | (24.85) | 6.60 | 26.55% |
| Administrative expenses | (19.65) | (24.30) | (4.65) | -19.14% |
| Distribution costs and Administrative expenses | (51.10) | (49.15) | 1.95 | 3.96% |
| Gain(Loss) on exchange rate | (1.44) | 0.31 | (1.75) | -564.19% |
| Operating profit | 26.20 | 21.15 | 5.05 | 23.87% |
| Operating profit margin (%) | 10.02% | 8.44% | 1.58% | |
| Finance costs | (0.73) | (0.81) | (0.08) | -10.38% |
| Income tax | (5.09) | (4.16) | 0.94 | 22.49% |
| Profit attributable to equity holders | 20.38 | 16.18 | 4.20 | 25.94% |
| Net profit margin (%) | 7.80% | 6.46% | 1.34% | |
| Basic earnings per share (Baht) | 0.10 | 0.08 | 0.02 | 25.94% |
Operating result according to the consolidated financial statements for the first quarter ended March 31, 2026, Phol Dhanya Public Company Limited (the Company) reported total revenue from sales and services of 260.48 million Baht, increased by 14.18 million Baht or 5.76% compared with revenue from sales and services of 246.31 million Baht in the same quarter of previous year. The increase in revenue was primarily driven by the Occupational Safety, Health and Environment products or ‘SAFETY’, which higher sales in personal protective equipment and sales increased in the Controlled Environment products, due to the addition of new products. Although revenue from the Medical and Healthcare products, as well as the Water Solution products and services declined, the Company was able to improve its profit margin by increasing the sales proportion of new products and products with high gross profit margins within the SAFETY and CE. Consequently, in the first quarter of 2026, the Company recorded a gross profit of 77.83 million baht, representing a gross profit margin of 29.88%, an increase of 18.19% compared to the same quarter of the previous year, which had a gross profit of 65.85 million baht, representing a gross profit margin of 26.74%. Meanwhile, distribution costs and administrative expenses increased slightly. Overall operating results for the first quarter of 2026, the Company reported a net profit attributable to owners of the parent of 20.38 million baht, representing a net profit margin of 7.80%, increased by 4.20 million baht, or 25.94%, compared to the same quarter of the previous year, which reported a net profit attributable to owners of the parent of 16.18 million baht, representing a net profit margin of 6.46%.
Revenue from Sales and Services
Unit : MB
| Revenue Structure | Q1/2026 | % | Q1/2025 | % | Increased (Decreased) |
% YoY |
|---|---|---|---|---|---|---|
| Occupational Safety, Health and Environment Products (SAFETY) | 206.43 | 79.25% | 188.47 | 76.52% | 17.96 | 9.53% |
| Control Environment Products (CE) | 42.98 | 16.50% | 40.69 | 16.52% | 2.29 | 5.62% |
| Medical and Healthcare Products | 9.23 | 3.54% | 12.26 | 4.98% | (3.02) | -24.65% |
| Water Solution Products (WATER) | 1.85 | 0.71% | 4.90 | 1.99% | (3.05) | -62.31% |
| Total revenue from sales and services | 260.48 | 100% | 246.31 | 100% | 14.18 | 5.76% |
* Note: The Company has reclassified some product items, which may result in differences in the 2025 figures compared to those previously reported.
In quarter 1/2026, the total revenue from sales and services provision were 260.48 million Baht, with 206.43 million Baht of Occupational Safety, Health and Environment Products or ‘SAFETY’ accounting for 79.25%, 42.98 million Baht of Control Environment Products or ‘CE’ accounting for 16.50%, 9.23 million Baht of Medical and Healthcare Products accounting for 3.54% and 1.85 million Baht of Water Solution Products or ‘WATER’ accounting for 0.71%.
Revenue from sales and services in the SAFETY products amounted to 206.43 million baht, an increase of 17.96 million baht, or 9.53%, compared to the same quarter of the previous year. This revenue growth was primarily driven by the sales of Personal Protective Equipment or PPE. The Company developed and introduced new products, particularly in the safety gloves and safety shoes categories, and additional product offerings to existing customers. This resulted in higher sales from both existing and new customers in the industrial sector, especially within the expanding food industries and automotive industries. Furthermore, for the SMEs and consumer segments, the Company has continuously enhanced its sales channels through the 'pholonline' website and various marketplaces such as Shopee and TikTok, as well as, expanding the product lineup to meet general consumer needs. In addition, for the telesales channels proactive followed up and offer products to existing customers. Consequently, sales increased across both the small-to-medium enterprise (SME) and general consumer segment.
The revenue from sales and services in the CE products amounted to 42.98 million Baht, an increase of 2.29 million Baht or 5.62% compared to the same quarter of the previous year. Major customers in the electronic parts manufacturing industry showed improved expansion. Furthermore, the Company introduced new products and offered additional items to both existing and new customers, resulting in increased revenue from the sale of new products and new customers.
The revenue from sales in the Medical and Healthcare Products amounted to 9.23 million Baht, a decrease 3.02 million Baht or 24.65% compared to the same quarter of the previous year, This decline was primarily due to a lower volume of government bidding contracts for adult diapers compared to the same quarter of last year. However, revenue generated from the marketing of new products within the medical and hospital equipment segment continued to show sales revenue growth.
The revenue from sales and services in the WATER products amounted to 1.85 million Baht, a decrease 3.05 million Baht or 62.31% compared to the same quarter of the previous year.This decline in revenue was primarily driven by a reduction in water treatment system construction projects, as well as a decrease in sales of related equipment compared to the same quarter of the previous year.
Other income
In quarter 1/2026, the Company reported other income of 0.91 million Baht, a decrease of 3.23 million Baht compared to other income of 4.14 million Baht in the same quarter of the previous year, mainly due to the receipt of fines and fees from water treatment projects that end of the lawsuit in in the same quarter of the previous year.
Cost of Sales and Services and Gross Profit
In quarter 1/2026, The Company reported total costs of 182.66 million baht, comprising cost of sales of 180.81 million baht and cost of services of 1.85 million baht. The total cost increased by 2.20 million baht, or 1.22%, in line with higher revenue from sales and services. However, the cost of imported goods decreased due to the appreciation of the Thai baht during the preceding period. Additionally, a higher sales proportion of new products and products with high gross profit margins brought the ratio of the cost of sales and services to 70.12% of the total revenue from sales and services. As a result, gross profit stood at 77.83 million baht, representing a gross profit margin of 29.88%. This gross profit increased by 11.98 million baht, or 18.19%, compared to the same quarter of the previous year, which a gross profit of 65.85 million baht, representing a gross profit margin of 26.74%.
Distribution Costs and Administrative Expenses
Distribution costs and administrative expenses in the first quarter of 2026 amounted to 51.10 million baht, an increase 1.95 million baht, or 3.96%, compared to the same quarter of the previous year. This increase was primarily driven by higher employee salaries and benefits resulting from annual wage adjustments and increase in headcount. Additionally, sales commissions that vary with sales revenue, and higher marketing expenses and selling fees from various online channels. However, consulting and legal fees decreased compared to the previous year.
In quarter 1/2026, the company reported loss on exchange rate of 1.44 million baht, compared to an exchange rate gain of 0.31 million baht in the same quarter of the previous year, due to the relatively high volatility of the Thai baht.
Financial cost amounted to 0.73 million Baht, a decrease of 0.08 million Baht or 10.38% compared to financial cost of 0.81 million Baht in the same quarter of previous year, mainly due to lower long-term loan from financial institutions.
Net Profit
In quarter 1/2026, the company reported net profit attributable to equity holders of 20.38 million Baht, representing the net profit margin of 7.80%, increased by 4.20 million Baht or 25.94%, compared to net profit attributable to equity holders of 16.18 million Baht, representing the net profit margin of 6.46% in the same quarter of previous year.
Financial Position
Unit : MB
| March 31, 2026 | December 31, 2025 | Increased (Decreased) |
% Change |
|||
|---|---|---|---|---|---|---|
| Amount | % | Amount | % | |||
| Current Assets | 532.66 | 77.21% | 507.90 | 75.87% | 24.76 | 4.88% |
| Non-Current Assets | 157.21 | 22.79% | 161.52 | 24.13% | -4.31 | -2.67% |
| Total Assets | 689.87 | 100.00% | 669.42 | 100.00% | 20.45 | 3.05% |
| Current Liabilities | 172.91 | 25.07% | 71.83 | 25.67% | 1.08 | 0.63% |
| Non-Current Liabilities | 82.38 | 11.94% | 83.39 | 12.46% | -1.01 | -1.22% |
| Total Liabilities | 255.29 | 37.01% | 55.22 | 38.13% | 0.07 | 0.03% |
| Shareholder's Equity of the Company |
434.46 | 62.99% | 414.08 | 61.87% | 20.38 | 4.92% |
Assets
As of March 31, 2026, the Company’s total assets stood at 689.87 million baht, an increase of 20.45 million baht or 3.05% from December 31, 2025. The increase in total assets was primarily driven by 24.76 million baht or 4.88% increase in current assets, resulting from trade and other current receivables (net) increased 17.88 million baht and cash and cash equivalents increased 8.31 million baht. Meanwhile, inventories decreased 1.42 million baht. Non-current assets decreased by 4.31 million baht or 2.67%, mainly due to a decline in deferred tax assets of 2.91 million baht and property, plant, and equipment decreased by 1.05 million baht.
Liabilities
As of March 31, 2026, total liabilities amounted to 255.29 million baht, increase of 0.07 million baht or 0.03% from December 31, 2025. The increase in total liabilities was mainly from an increase of short-term loans from financial institutions 6.67 million baht and accrued income tax increased 2.12 million Baht, while trade and other current payables decreased 7.56 million baht. Non-current liabilities decreased by 1.01 million baht or 1.22%, primarily due to a 1.79 million baht reduction in long-term loan from financial institutions, while the provision for employee benefits increased by 0.93 million Baht.
Shareholder’s equity
As of March 31, 2026, the Company reported shareholders’ equity of 434.46 million Baht, increased of 20.38 million Baht or 4.92% from December 31, 2025, mainly from net profit for the period.
Cash Flow
Unit : MB
| Cash Flow | March 31, 2026 | March 31, 2025 |
|---|---|---|
| Cash flow from (used in) operating activities | 5.02 | -0.64 |
| Cash flow from (used in) investing activities | -0.62 | -0.71 |
| Cash flow from (used in) financing activities | 3.91 | 35.75 |
| Net increase (decrease) in cash and cash equivalents | 8.31 | 34.40 |
| Cash and cash equivalents at beginning of the period | 100.34 | 58.33 |
| Cash and cash equivalents at the end of the period | 108.65 | 92.73 |
For the three month period, ended March 31, 2026, the Company’s net cash from operating activities of 5.02 million Baht, with operating profits prior to changes in the operating assets and liabilities of 13.72 million Baht. Cash flow increased mainly from net-inventories decreased 0.52 million Baht. However, Cash flow decreased from trade and other receivables increased 1.43 million Baht and payment of trade and other current payables of 7.56 million Baht.
Cash flow used in investment activities of 0.62 million Baht to purchase office equipment of 1.02 million Baht and the provision of loans to joint ventures amounting to 0.20 million Baht. However, cash flow acquired from interest receive of 0.10 million Baht, receive of 0.10 million baht from the disposal of assets and received repayment of loans to employees of 0.40 million Baht.
Cash flow increased from financing activities of 3.91 million Baht, mainly received from short-term loans from financial institutions of 6.67 million Baht. However, cash decreased from repayments of long-term loans from financial institutions of 1.79 million Baht, repayments of liabilities under lease agreements of 0.25 million Baht, and interest payments of 0.73 million Baht.
Key Financial Ratio
| Financial Ratios | Q1/2026 | Q1/2025 | |
|---|---|---|---|
| Liquidity Ratios | |||
| Current Ratio | Times | 3.08 | 2.56 |
| Quick Ratio | Times | 1.62 | 1.32 |
| D/E Ratio | Times | 0.59 | 0.70 |
| Interest Coverage Ratio | Times | 36.13 | 26.14 |
| Profitability Ratio | |||
| Gross Profit Margin | % | 29.88 | 26.74 |
| Operating Profit Margin | % | 10.02 | 8.44 |
| Net Profit Margin | % | 7.80 | 6.46 |
| Return on Equity | % | 16.61 | 16.55 |
| Return on Asset | % | 13.02 | 10.95 |
| Activity Ratio | |||
| Account Receivable Turnover | Times | 6.31 | 6.21 |
| Average Collection Period | Days | 57.82 | 58.76 |
| Inventory Turnover | Times | 3.02 | 3.02 |
| Average Sale Period | Days | 120.89 | 120.73 |
| Account Payable Turnover | Times | 7.59 | 7.39 |
| Average Payment Period | Days | 48.09 | 49.41 |
| Cash Cycle | Days | 130.61 | 130.09 |
Management Discussion & Analysis (MD&A) Yearly 2025
OVERVIEW
Unit : MB
| Y2025 | Y2024 | Increased (Decreased) |
% YoY | |
|---|---|---|---|---|
| Revenue from sales | 993.34 | 978.55 | 14.79 | 1.51% |
| Revenue from services | 23.32 | 35.98 | (12.66) | -35.19% |
| Total revenues | 1,016.66 | 1,014.54 | 2.12 | 0.21% |
| Cost of sales | (710.63) | (726.13) | (15.49) | -2.13% |
| Cost of services | (17.42) | (29.09) | (11.67) | -40.13% |
| Total costs | (728.05) | (755.21) | (27.17) | -3.60% |
| Gross profit | 288.61 | 259.32 | 29.29 | 11.29% |
| Gross profit margin (%) | 28.39% | 25.56% | 2.83% | |
| Other income | 9.51 | 4.88 | 4.62 | 94.70% |
| Distribution costs | (110.72) | (100.63) | 10.09 | 10.02% |
| Administrative expenses | (104.46) | (93.54) | 10.92 | 11.67% |
| Gain on exchange rate | 2.44 | 1.95 | 0.49 | 25.01% |
| Operating profit | 85.39 | 71.99 | 13.40 | 18.61% |
| Operating profit margin (%) | 8.32% | 7.06% | 1.26% | |
| Finance costs | (3.52) | (3.17) | 0.36 | 11.20% |
| Share of profit(Loss) form investment in joint ventures | - | (0.07) | (0.07) | -100.00% |
| Income tax | (15.79) | (3.06) | 12.73 | 416.43% |
| Profit attributable to equity holders | 66.07 | 65.69 | 0.38 | 0.58% |
| Net profit margin (%) | 6.44% | 6.44% | -0.01% | |
| Basic earnings per share (Baht) | 0.33 | 0.32 | 0.002 | 0.58% |
Based on the consolidated financial statements for the year ended December 31, 2025, Phol Dhanya Public Company Limited (the Company) reported total revenue from sales and services of 1,016.66 million Baht, increase by 2.12 million Baht, or 0.21%, compared to the previous year's total revenue from sales and services of 1,014.54 million Baht. In 2025, revenue from sales of Occupational Safety, Health and Environment products or SAFETY, as well as the Medical and Healthcare products, increased. Conversely, revenue from the sale of Control Environment products or CE and revenue from services of Water Solution products or ‘WATER’ decreased compared to the previous year. Other income, totaling 9.51 million Baht, increased from the previous year, primarily due to the receipt of fines and fees from water treatment projects that end of the lawsuit.
In terms of gross profit, there was an increase compared to the previous year. In 2025, the company reported a gross profit of 288.61 million Baht, representing a gross profit margin of 28.39%, increase of 29.29 million Baht, or 11.29%, compared to the previous year's gross profit of 259.32 million Baht, representing a gross profit margin of 25.56%. This increase was due to a higher proportion of sales from new products and product items with high gross profit margins. Additionally, the cost of goods decreased due to the strengthening of the Thai Baht compared to the previous year. Distribution costs and administrative expenses totaled 215.17 million Baht, an increase compared to the previous year, primarily driven by employee compensation and other benefits, as well as advertising and sales promotion expenses from new products and online sales channel marketing.
In 2025, operating profit totaled 85.39 million Baht, an increase of 13.40 million Baht, or 18.61%, compared to the previous year's operating profit of 71.99 million Baht. Net profit attributable to the parent company was 66.07 million Baht, representing a net profit margin of 6.44%. This is a slight increase from the previous year's net profit attributable to the parent company of 65.69 million Baht, which also had a net profit margin of 6.44%, due to the tax loss recognized from the disposal of investment in a subsidiary in previous year, resulting in a tax expense of 3.06 million Baht, while, the tax expense for year 2025 was 15.79 million Baht.
Revenue from Sales and Services
Unit : MB
| Revenue Structure | Y2025 | % | Y2024 | % | Increased (Decreased) |
% YoY |
|---|---|---|---|---|---|---|
| Occupational Safety, Health and Environment Products (SAFETY) | 775.93 | 76.32% | 742.67 | 73.20% | 33.26 | 4.48% |
| Control Environment Products (CE) | 166.06 | 16.33% | 178.55 | 17.60% | (12.49) | -7.00% |
| Medical and Healthcare Products | 44.93 | 4.42% | 37.14 | 3.66% | 7.79 | 20.98% |
| Water Solution Products (WATER) | 29.74 | 2.92% | 56.17 | 5.54% | (26.44) | -47.06% |
| Total revenue from sales and services | 1,016.66 | 100% | 1,014.54 | 100% | 2.12 | 0.21% |
*Note:The Company has reclassified some product items, which may result in differences in the 2024 figures compared to those previously reported.
In 2025, the company's total sales and services revenue was 1,016.66 million Baht, derived from the Occupational Safety, Health and Environment Products or ‘SAFETY’ at 775.93 million Baht, accounting for 76.32%; the Control Environment Products or ‘CE’ at 166.06 million Baht, accounting for 16.33%; the Medical and Healthcare products at 44.93 million Baht, accounting for 4.42%; and Water Solution Products or ‘WATER’ at 29.74 million Baht, accounting for 2.92%.
Revenue from sales and services in the SAFETY products amounted to 775.93 million Baht, an increase of 33.26 million Baht or 4.48% compared to the previous year. The main increase in sales revenue was in the Personal Protective Equipment (PPE), driven by product development and additional product offerings to existing customers, the launch of new product models, especially in the safety shoe category under the Company’s own ROCC brand, as well as premium safety shoes category, leading to an increased sales to both existing and new customers in the industrial sector. Furthermore, continuous development and expansion of online and tele-sales channels resulted in increased sales to SME customers and individual customers.
Revenue from sales and services in the CE products amounted to 166.06 million Baht, a decrease of 12.49 million Baht or 7% compared to the previous year. The main customers are in the electronics parts manufacturing industry, where production expansion, although improved, was not at a very high rate. Furthermore, increased competition and customer production process developments allowed for the use of products with reduced specifications and prices, leading to a decrease in CE products sales revenue. However, the company has added new product items and offered additional products to existing and new customer bases, resulting in increased revenue from new products and new customers.
Revenue from sales in the Medical and Healthcare Products amounted to 44.93 million Baht, an increase of 7.79 million Baht or 20.98% compared to the previous year. This growth was driven by the new products marketing in the medical and hospital equipment and healthcare products, such as operating room equipment, adult diapers, and ergonomic devices, resulted in higher sales from both the government agencies, public and private hospitals, and various online channels.
Revenue from sales and services in the WATER products amounted to 29.74 million Baht, a decrease of 26.44 million Baht or 47.06% compared to the previous year. This was due to the nature of project-based design and construction services, which saw a reduction in volume compared to the previous year. Additionally, there was a decrease in revenue from the sale of machinery and equipment.
Other income
In 2025, the Company reported other income of 9.51 million Baht, an increase compared to the previous year. The increase in other income was mainly due to the receipt of fines and fees from water treatment projects that end of the lawsuit, as well as the receipt of rebates from suppliers.
Cost of Sales and Services
In 2025, the company's total cost was 728.05 million Baht, comprising cost of sales of 710.63 million Baht and cost of services of 17.42 million Baht. The cost of sales and services decreased by 27.17 million Baht or 3.60%. The primary reason for the decrease in cost of sales was the lower cost of imported goods due to the strengthening of the Thai Baht compared to the previous year. The cost of services decreased in line with lower revenue from services. The proportion of cost of sales and services accounted for 71.61% of total revenue from sales and services, resulting in a gross profit of 288.61 million Baht, representing a gross profit margin of 28.39%. Gross profit increased by 29.29 million Baht or 11.29% compared to the previous year's gross profit of 259.32 million Baht, which representing a gross profit margin of 25.56%. This increase in gross profit was partly attributable to a lower cost of goods, additionally, the sales proportion of new products and product items with high gross profit margins increased.
Distribution Costs and Administrative Expenses
Distribution Costs and administrative expenses in 2025 amounted to 215.17 million Baht, consisting of distribution costs of 110.72 million Baht and administrative expenses of 104.46 million Baht. Distribution Costs and administrative expenses increased by 21 million Baht or 10.82%. The primary reason for the increase in distribution costs was higher advertising and sales promotion costs, marketing expenses, and online sales channel fees, which increased by 4.04 million Baht, as well as sales commissions that vary with sales revenue. Administrative expenses increased mainly from compensation, welfare, and employee benefits, as well as the donation of safety and health products and equipment provided to hospitals, foundations, and various educational institutions, which increased by 3.78 million Baht.
Financial costs
In 2025, financial costs amounted to 3.52 million Baht, an increase of 0.36 million Baht or 11.20% compared to the previous year's financial costs of 3.17 million Baht, due to an increase in long-term loans from financial institutions.
Tax expenses
In 2025, the company incurred tax expenses of 15.79 million Baht, representing an effective tax rate of 19.29%. Tax expenses increased by 12.73 million Baht from the previous year's tax expenses of 3.06 million Baht, which representing an effective tax rate of 4.45% mainly due to the fact that, there was a tax loss recognized from the disposal of investment in a subsidiary of 9.57 million Baht in the previous year, which led to tax expenses being lower than the statutory rate
Operating profit and Net Profit
In 2025, the company reported an operating profit of 85.39 million Baht, representing an operating profit margin of 8.32%, an increase of 13.40 million Baht or 18.61% compared to the previous year's operating profit of 71.99 million Baht, which representing an operating profit margin of 7.06%. The net profit attributable to the parent company was 66.07 million Baht, representing a net profit margin of 6.44%, a slight increase from the previous year's net profit attributable to the parent company of 65.69 million Baht, which also representing a net profit margin of 6.44%, mainly due to the tax loss recognized from the disposal of investment in a subsidiary, resulting in a tax expense of 3.06 million Baht in the previous year, whereas in 2025, tax expenses were 15.79 million Baht.
Financial Position
Unit : MB
| December 31, 2025 | December 31, 2024 | Increased (Decreased) |
% Change |
|||
|---|---|---|---|---|---|---|
| Amount | % | Amount | % | |||
| Current Assets | 507.90 | 75.87% | 488.47 | 75.03% | 19.43 | 3.98% |
| Non-Current Assets | 161.52 | 24.13% | 162.54 | 24.97% | (1.01) | -0.62% |
| Total Assets | 669.42 | 100.00% | 651.01 | 100.00% | 18.41 | 2.83% |
| Current Liabilities | 171.83 | 25.67% | 219.15 | 33.67% | (47.32) | -21.59% |
| Non-Current Liabilities | 83.39 | 12.46% | 36.25 | 5.57% | 47.14 | 130.03% |
| Total Liabilities | 255.22 | 38.13% | 255.40 | 39.24% | (0.18) | -0.07% |
| Shareholder's Equity of the Company | 414.08 | 61.87% | 395.49 | 60.76% | 18.59 | 4.70% |
Assets
As of December 31, 2025, the Company reported total assets of 669.42 million Baht, an increase of 18.41 million Baht or 2.83% from December 31, 2024. The increase in total assets was mainly from current assets, which increased of 19.43 million Baht or 3.98% from cash and cash equivalents increased 42.01 million Baht, trade and other current receivables-net increased 6.30 million Baht. Meanwhile, net-inventories decreased 26.03 million Baht, short-term loans to joint ventures decreased 1.63 million Baht and income tax assets for the current period decreased 1.09 million Baht.
Non-current assets decreased by 1.01 million Baht or 0.62%. The primary decrease in non-current assets was due to net-property, plant, and equipment, which decreased mainly from depreciation and amortization of 9.44 million Baht, while purchases of operating assets increased by 6.62 million Baht.
Liabilities
As of December 31, 2025, the Company reported total liabilities of 255.22 million Baht, a slight decrease of 0.18 million Baht or 0.07% from December 31, 2024. Current liabilities decreased by 47.32 million Baht or 21.59%, mainly from short-term loans from financial institutions decreased 43.92 million Baht, trade and other payables decreased 12.66 million Baht and current portion of leases liabilities decreased 1.42 million Baht. However, current portion of long-term loans from financial institutions increased 7.14 million Baht and accrued income tax increased 3.33 million Baht
Non-current liabilities increased by 47.14 million Baht or 130.03%, primarily due to an increase in long-term loans from financial institutions by 36.32 million Baht to provide working capital and enhance the Company's financial liquidity. Lease liabilities increased by 1.58 million Baht, and provision of employee benefits increased by 9.25 million Baht.
Shareholder’s equity
As of December 31, 2025, the Company reported shareholders’equity of 414.08 million Baht, increased 18.59 million Baht or 4.70% from December 31, 2024 from profit for the period of 66.07 million Baht.However, shareholders’equity decreased from additional allocation to legal reserve of 2.31 million Baht and dividend payment of 46.57 million Baht.
Cash Flow
Unit : MB
| Cash Flow | December 31, 2025 | December 31, 2024 |
|---|---|---|
| Cash flow from operating activities | 96.17 | 59.34 |
| Cash flow from (used in) investing activities | (1.64) | 3.33 |
| Cash flow used in financing activities | (52.75) | (66.09) |
| Net increase (decrease) in cash and cash equivalents | 41.79 | (3.42) |
| Cash and cash equivalents at beginning of the period | 58.33 | 61.68 |
| Cash and cash equivalents at the end of the period | 100.34 | 58.33 |
For the year ended December 31, 2025, the Company’s net cash from operating activities of 96.17 million Baht, with operating profits prior to changes in the operating assets and liabilities of 98.66 million Baht. Cash flow decreased mainly from trade and other receivables increased 6.38 million Baht, payment of trade and other current payables of 12.65 million Baht and income tax payment of 13.05 million baht. However, cash flow increased from net-inventories decreased 29.60 million Baht.
Cash flow used in investment activities of 1.64 million Baht to purchase of operating assets of 3.22 million Baht and purchase software computer of 0.29 million Baht and short-term loans to joint ventures of 0.37 million Baht. However, cash flow acquired from received repayment of loans to joint ventures of 2 million Baht and interest receive of 0.70 million Baht.
Cash flow used in financing activities of 52.75 million Baht, to payments of short-term loans from financial institutions of 43.92 million Baht, repayments of long-term loans from financial institutions of 6.55 million Baht, payments of liabilities under lease agreements of 2.18 million Baht, interest payments of 3.53 million Baht and dividend payment of 46.57 million Baht. However, cash flow received from long-term loans from financial institutions of 50 million Baht.
Key Financial Ratio
| Financial Ratio | Y2025 | Y2024 | |
|---|---|---|---|
| Liquidity Ratios | |||
| Current Ratio | times | 2.96 | 2.23 |
| Average Collection Period | days | 56.69 | 54.96 |
| Average Sale Period | days | 120.64 | 119.84 |
| Average Payment Period | days | 47.09 | 48.52 |
| Cash Cycle | days | 130.24 | 126.27 |
| Profitability Ratio | |||
| Gross Profit Margin | % | 28.39% | 25.56% |
| Operating Profit Margin | % | 8.32% | 7.05% |
| Net Profit Margin | % | 6.44% | 6.44% |
| Return on Equity | % | 16.32% | 17.07% |
| Operating Efficiency Ratio | |||
| Return on Asset | % | 12.93% | 11.11% |
| Leverage Ratios | |||
| D/E Ratio | times | 0.62 | 0.65 |
| Interest Coverage | times | 24.23 | 22.69 |
Summary of Key Sustainability Performance in 2025
- The Company received an "A" rating in the SET ESG Ratings for 2025 for the third consecutive year from The Stock Exchange of Thailand.
- The company received an “Excellent” CG Score in the 2025 Corporate Governance Report of Thai Listed Companies for the eleventh consecutive year.
- The Company's membership in the Thai Private Sector Collective Action Against Corruption (CAC) was renewed for the third consecutive time. The Company has been certified as a CAC member since 2016.
- The Company prepared its organizational carbon footprint in accordance with the guidelines of the Thailand Greenhouse Gas Management Organization (TGO). In 2025, the Company reported Scope 1, 2, and 3 organizational greenhouse gas emissions of 1,437 tCO2e, and the Company is currently in the process of seeking data verification from TGO.
- The Company received a certificate of honor from the Stock Exchange of Thailand for participating in the "ESG DNA Project," which encourages employees to attend training, enhance their understanding of ESG principles, and instill a sustainability DNA among employees.
Significant factors or incidents that may materially affect the future financial condition or the operating results
For 2026, the Company has set goals for continuous growth, along with close monitoring and management of risk factors concerning economic, social and environmental issues, in order to respond to changes in time, in terms of product and service development, strengthening of the Company’s own brand, and the expansion of distribution channels to accommodate the expansion of all groups of customers. In the meantime, the Company will strive to improve its internal processes, adopt information technology to enhance operational effectiveness, and continue to improve the human resources potential, to elevate the quality of services and competitive advantage, as well as emphasize the minimization of social and environmental impact from business operations.
Overall, the Thai economy is projected to grow by approximately 1.6 – 2.0%, which is considered a low growth rate. This is due to various surrounding pressure factors, including the global economic slowdown resulting from uncertainties in the economic policies and tax measures of the United States, intensifying international conflicts, and rising business costs from both energy expenses and inflation rates. These factors may impact the overall economy and affect the company's operational performance. However, in the industrial manufacturing sector, the Office of Industrial Economics estimates the Manufacturing Production Index (MPI) for 2026 to grow by 1-2%. This is supported by government economic stimulus measures, the continued growth trend of Thailand's international trade with key partners, and the direction of easing policy interest rates. Key industries in Thailand, such as the electronics industry, automotive industry, petrochemical-chemical industry, medical industry, and tourism industry, are still projected to grow, thereby supporting the demand for the company's products and services.
The company has established growth strategies in the in the distribution of safety, occupational health and environmental products, control environment products, medical and healthcare products, by launching new products and services, and developing house brands to maintain the existing customer base in the industrial sector and accommodate the expansion to other potential industries. The focus is also on collaboration with manufacturers who can respond to customers’ specific requirements, as well as following up with the relevant government’s spending policies in preparation for the bid rounds according to the procurement process, electronic bidding and specific bidding. For general consumers, the focus is on the development of online sales and tele-sales channels, the use of online marketing and communication tools to enhance access to the Company’s products and services, fast services, and addition of safety lifestyle products, healthcare products, and products for the elderly to respond to consumers’ demand.
For the water and environmental treatment system services business, the focus is on providing integrated water management services, from clean water production systems and wastewater treatment systems to water recycling technologies using Membrane Bio Reactor (MBR) systems, Ultrafiltration (UF) systems, and Reverse Osmosis (RO) systems, including innovative high-efficiency sludge dewatering machines. The target customers in the industrial sector will emphasize monitoring proposals for water treatment system projects, selling products, and providing after-sales services, particularly to the existing customer base. This also includes monitoring proposals for water treatment system projects and other environmental management systems from government agencies. Additionally, there are plans to expand operations into energy management products and services, such as lighting systems and renewable energy, which show future growth potential.
Management Discussion & Analysis (MD&A) Quarter 3/2025
Overview
Unit : MB
| Q3/2025 | Q3/2024 | Increased (Decreased) |
% YoY | 9M/2025 | 9M/2024 | Increased (Decreased) |
% YoY | |
|---|---|---|---|---|---|---|---|---|
| Revenue from sales | 254.32 | 255.68 | (1.36) | -0.53% | 739.07 | 737.18 | 1.89 | 0.26% |
| Revenue from rendering of services | 7.11 | 9.82 | (2.70) | -27.54% | 16.33 | 24.81 | (8.48) | -34.19% |
| Total Revenues | 261.44 | 265.50 | (4.06) | -1.53% | 755.40 | 761.99 | (6.59) | -0.86% |
| Cost of sales | (177.41) | (194.77) | (17.36) | -8.91% | (531.63) | (549.04) | (17.41) | -3.17% |
| Cost of services | (5.66) | (7.81) | (2.15) | -27.50% | (12.76) | (19.73) | (6.97) | -35.33% |
| Total Costs | (183.07) | (202.58) | (19.51) | -9.63% | (544.39) | (568.77) | (24.38) | -4.29% |
| Gross Profit | 78.36 | 62.92 | 15.45 | 24.55% | 211.01 | 193.22 | 17.79 | 9.21% |
| Gross Profit Margin (%) | 29.97% | 23.70% | 6.28% | 27.93% | 25.36% | 2.58% | ||
| Other income | 1.10 | 0.88 | 0.22 | 25.49% | 9.03 | 2.38 | 6.66 | 280.13% |
| Distribution costs | (27.40) | (25.10) | 2.30 | 9.16% | (81.01) | (75.28) | 5.73 | 7.62% |
| Administrative expenses | (28.68) | (22.60) | 6.09 | 26.93% | (75.17) | (69.45) | 5.72 | 8.23% |
| Gain (Loss) on exchange rate | 0.55 | 4.23 | (3.69) | -87.06% | 1.71 | 2.70 | (0.99) | -36.58% |
| Profit before finance costs and income taxes | 23.93 | 20.33 | 3.60 | 17.71% | 65.57 | 53.56 | 12.01 | 22.42% |
| Profit before finance costs and income taxes (%) | 9.11% | 7.63% | 1.48% | 8.58% | 7.01% | 1.57% | ||
| Finance costs | (0.90) | (0.90) | 0.00 | 0.00% | (2.70) | (2.39) | 0.31 | 12.80% |
| Share of profit(Loss) form investment in joint ventures | - | 0.07 | (0.07) | -100.00% | - | (0.13) | (0.13) | -100.00% |
| Income tax | (3.59) | (0.15) | 3.44 | 2,231.17% | (12.15) | 0.25 | 11.90 | 4,758.80% |
| Profit attributable to equity holders | 19.44 | 19.35 | 0.09 | 0.48% | 50.73 | 51.30 | (0.57) | -1.11% |
| Net profit margin (%) | 7.41% | 7.26% | 0.14% | 6.64% | 6.71% | -0.08% | ||
| Basic earnings per share (Baht) | 0.10 | 0.10 | 0.0005 | 0.48% | 0.25 | 0.25 | (0.003) | -1.11% |
Operating result according to the consolidated financial statements for the third quarter ended September 30, 2025, Phol Dhanya Public Company Limited (the Company) reported total revenue from sales and services of 261.44 million Baht, decreased 4.06 million Baht or 1.53% compared with revenue from sales and services of 265.50 million Baht in the same quarter of previous year. In Q3/2025, revenue from sales of Occupational Safety, Health and Environment products or ‘SAFETY’ increased. Meanwhile, revenue from the Control Environment products or ‘CE’and Medical and Healthcare products decreased, along with a reduction in revenue from services of Water Solution products or ‘WATER’. However, gross profit increased compared to the same quarter of the previous year, in Q3/2025, the company reported a gross profit of 78.36 million Baht, representing a gross profit margin of 29.97%, increased 15.45 million Baht or 24.55% compared to a gross profit of 62.92 million Baht, representing a gross profit margin of 23.70% in the same quarter of previous year, due to an increased sales proportion of new products and product items with higher gross profit margins. Additionally, the cost of goods decreased due to the strengthening of the Thai Baht compared to the previous year. Distribution costs and administrative expenses were 56.08 million baht. The Company's operating result for Q3/2025 reported operating profit of 23.93 million Baht, representing the operating profit margin of 9.11%, increased 3.60 million Baht or 17.71%, compared to the same quarter of the previous year with operating profit of 20.33 million Baht, representing the operating profit margin of 7.63%. However, net profit attributable to shareholders of the parent company for Q3/2025 was 19.44 million Baht, representing a net profit margin of 7.41%, increased 0.09 million Baht or 0.48% from the same quarter of the previous year, which reported a net profit of 19.35 million Baht, representing a net profit margin of 7.26%, due to the tax loss recognized from the disposal of investment in a subsidiary in previous year, resulting in a tax expense of 0.15 million Baht, while, the tax expense for Q3/2025 was 3.59 million Baht.
For the nine months period, ending September 30, 2025, the Company reported total revenue from sales and services of 755.40 million Baht decreased 6.59 million Baht or 0.86%, compared to the revenue from sales and services of 761.99 million Baht in the same period of previous year. Gross profit was 211.01 million Baht, representing a gross profit margin of 27.93%, increased 17.79 million Baht or 9.21% compared to a gross profit of 193.22 million Baht, representing a gross profit margin of 25.36% in the same period of last year. In addition, other income amounted to 9.03 million Baht, an increase mainly from the receipt of fines and fees from water treatment projects that end of the lawsuit. With total distribution costs and administrative expenses of 156.18 million baht, the operating profit was 65.57 million Baht, increased 12.01 million Baht or 22.42% compared to the operating profit of 53.56 million Baht in the same period of previous year. Net profit attributable to shareholders of the parent company for the nine-month period ended September 30, 2025, was 50.73 million Baht, representing a net profit margin of 6.64%, slightly lower than the previous year’s net profit of 51.30 million Baht, representing a net profit margin of 6.71%, mainly due to the fact that in the previous year, the Company did not incur income tax expenses as it recognized a tax loss arising from the disposal of investments in a subsidiary, while, the tax expense for the 2025 was 12.15 million Baht.
Revenue from Sales and Services
Unit : MB
| Q3/2025 | % | Q3/2024 | % | Increased (Decreased) |
% YoY | 9M/2025 | % | 9M/2024 | % | Increased (Decreased) |
% YoY | |
|---|---|---|---|---|---|---|---|---|---|---|---|---|
| Occupational Safety, Health and Environment Products (SAFETY) | 196.84 | 75.29% | 192.27 | 72.42% | 4.57 | 2.38% | 570.56 | 75.53% | 558.05 | 73.24% | 12.51 | 2.24% |
| Control Environment Products (CE) | 42.79 | 16.37% | 46.20 | 17.40% | (3.41) | -7.37% | 124.76 | 16.52% | 135.29 | 17.76% | (10.53) | -7.78% |
| Water Solution Products (WATER) | 10.13 | 3.87% | 11.38 | 4.28% | (1.25) | -10.95% | 23.08 | 3.06% | 40.67 | 5.34% | (17.59) | -43.25% |
| Medical and Healthcare Products | 11.68 | 4.47% | 15.66 | 5.90% | (3.98) | -25.42% | 37.00 | 4.90% | 27.98 | 3.67% | 9.02 | 32.24% |
| Total revenue from sales and services | 261.44 | 100% | 265.50 | 100% | (4.06) | -1.53% | 755.40 | 100% | 761.99 | 100% | (6.59) | -0.86% |
In Q3/2025, the total revenue from sales and services provision were 261.44 million Baht, with 196.84 million Baht of Occupational Safety, Health and Environment Products or ‘SAFETY’ accounting for 75.29%, 42.79 million Baht of Control Environment Products or ‘CE’ accounting for 16.37%, 10.13 million Baht of Water Solution Products or ‘WATER’ accounting for 3.87%, and 11.68 million Baht of Medical and Healthcare Products accounting for 4.47%.
The revenue from sales and services provision in SAFETY products was 196.84 million Baht, increased 4.57 million Baht or 2.38% compared to the same quarter of the previous year. The increase was mainly driven by higher sales of personal protective equipment, as the company launched new product models, especially in the safety shoe category, under the Company’s own ROCC brand, as well as in the premium safety shoe category, leading to higher sales from both existing and new customers in the industrial sector. In addition, the development of online and telesales channels, resulted in increased sales form SME customers and individual consumers.
The revenue from sales and services provision in CE products was 42.79 million Baht, decreased 3.41 million Baht or 7.37% compared to the same quarter of the previous year. Major customers in the electronics parts manufacturing industry have decreased production according to the slowdown in the electronics industry. However, the company has added new products, resulting in increased sales among new customers.
The revenue from sales and services provision in the WATER products was 10.13 million Baht, decreased 1.25 million Baht or 10.95% compared to the same quarter of the previous year. The significant decline in revenue was primarily due to the lower sales of machinery and equipment, as well as, a reduction in revenue from construction project contracts for water treatment systems, compared to the same period of the previous year.
The revenue from sales provision in Medical and Healthcare Products was 11.68 million Baht decreased 3.98 million Baht or 25.42% compared to the same quarter of the previous year, the primary source of the revenue decline was from adult diaper products, which lower sales from the government agencies customer. However, sales from online channels increased when compared to the same quarter of the previous year.
Cost of Sales and Services
In Q3/2025, The Company reported total costs of 183.07 million Baht, comprising cost of sales of 177.41 million Baht and cost of services of 5.66 million Baht. Cost of sales and services decreased 19.51 million Baht or 9.63% in line with lower revenue from sales and services and lower imported goods costs due to the strengthening of the Thai Baht compared to the previous year. The cost of sales and services represented 70.03% of total revenue from sales and services. Gross profit was 78.36 million Baht, equivalent to a gross profit margin of 29.97%, increased 15.45 million Baht or 24.55%, compared to gross profit of 62.92 million Baht, equivalent to a gross profit margin of 23.70% in the same quarter of the previous year.This increase in gross profit was partly attributable to a lower cost of goods, additionally, the sales proportion of new products and product items with high gross profit margins increased.
Distribution Costs and Administrative Expenses
In Q3/2025, Distribution costs and administrative expenses amounted to 56.08 million Baht, consisting distribution costs of 27.40 million Baht and administrative expenses of 28.68 million Baht. Distribution costs increased primarily driven by higher advertising and promotion expenses, marketing expenses and fees associated with various online sales channels, and administrative expenses increased mainly from compensation, welfare, and employee benefits, as well as the donation of safety and health products and equipment provided to hospitals, foundations, and various educational institutions, which totaled 3.86 million Baht.
Operating profit and Net Profit
In Q3/2025, the Company reported operating profit of 23.93 million Baht, representing the operating profit margin of 9.11%, increased 3.60 million Baht or 17.71%, compared to the same quarter of the previous year with operating profit of 20.33 million Baht, representing the operating profit margin of 7.63%. However, net profit attributable to equity holders in Q3/2025 was 19.44 million Baht, representing the net profit margin of 9.41%, increased 0.09 million Baht or 0.48%, compared to net profit attributable to equity holders of 19.35 million Baht, representing the net profit margin of 7.26% in the same quarter of previous year ,mainly due to the fact that the tax loss recognized from the disposal of investment in a subsidiary in previous year, resulting in a tax expense of 0.15 million Baht. While, the tax expense for Q3/2025 was 3.59 million Baht.
Financial Position
Unit : MB
| September 30, 2025 | December 31, 2024 | Increased (Decreased) |
% Change | |||
|---|---|---|---|---|---|---|
| Amount | % | Amount | % | |||
| Current Assets | 504.14 | 75.78% | 488.47 | 75.03% | 15.67 | 3.21% |
| Non Current Assets | 161.14 | 24.22% | 162.54 | 24.97% | (1.40) | -0.86% |
| Total Assets | 665.29 | 100.00% | 651.01 | 100.00% | 14.27 | 2.19% |
| Current Liabilities | 188.50 | 28.34% | 219.15 | 33.67% | (30.65) | -13.99% |
| Non Current Liabilities | 76.80 | 11.55% | 36.25 | 5.57% | 40.55 | 111.85% |
| Total Liabilities | 265.30 | 39.88% | 255.40 | 39.24% | 9.90 | 3.87% |
| Shareholder's Equity of the Company | 399.87 | 60.12% | 395.49 | 60.76% | 4.38 | 1.11% |
Assets
As of September 30, 2025, the Company reported total assets of 665.29 million Baht, increased 14.27 million Baht or 2.19% from December 31, 2024. The increase in total assets was mainly from current assets, which increased of 15.67 million Baht or 3.21% from cash and cash equivalents increased 16.47 million Baht, trade and other current receivables-net increased 11.93 million Baht. However, net-inventories decreased 10.03 million Baht, short-term loans to joint ventures decreased 1.63 million Baht and income tax assets for the current period decreased 1.09 million Baht.
Liabilities
As of September 30, 2025, the Company reported total liabilities of 265.30 million Baht, increased 9.90 million Baht or 3.87% from December 31, 2024. The increase in total liabilities was mainly from non-current liabilities, due to the increased of long-term loans from financial institutions of 38.10 million baht to provide working capital and enhance the Company's financial liquidity and provision of employee benefits increased 2.40 million Baht. However, current liabilities decreased mainly from short-term loans from financial institutions decreased 29.23 million Baht, trade and other payables decreased 6.69 million Baht and leases liabilities decreased 1.45 million Baht. However, current portion of long-term loans from financial institutions increased 7.14 million Baht.
Shareholder’s equity
As of September 30, 2025, the Company reported shareholders’equity of 399.87 million Baht, increased 4.38 million Baht or 1.11% from December 31, 2024 from profit for the period of 50.95 million Baht. However, shareholders’ equity decreased from dividend payment of 46.57 million Baht.
Cash Flows
Unit : MB
| Cash Flows | September 30, 2025 | September 30, 2024 |
|---|---|---|
| Cash flow from (used in) operating activities | 52.61 | 26.59 |
| Cash flow from (used in) investing activities | (1.44) | 4.98 |
| Cash flow from (used in) financing activities | (34.92) | (47.05) |
| Net increase (decrease) in cash and cash equivalents | 16.24 | (15.49) |
| Cash and cash equivalents at beginning of the period | 58.33 | 61.68 |
| Cash and cash equivalents at the end of the period | 74.80 | 46.27 |
For the nine month period, ended September 30, 2025, the Company’s net cash from operating activities of 52.61 million Baht, with operating profits prior to changes in the operating assets and liabilities of 74.95 million Baht. Cash flow decreased mainly from trade and other receivables increased 12.08 million Baht, payment of trade and other current payables of 6.69 million Baht and payment of income tax of 13.80 million baht. However, cash flow increased from net-inventories decreased 10.22 million Baht.
Cash flow used in investment activities of 1.44 million Baht to purchase office equipment of 2.74 million Baht and purchase software computer of 0.29 million Baht and short-term loans to joint ventures of 0.37 million Baht. However, cash flow acquired from received repayment of loans to joint ventures of 2 million Baht and interest receive of 0.26 million Baht.
Cash flow used in financing activities of 34.92 million Baht, to payments of short-term loans from financial institutions of 29.23 million Baht, repayments of long-term loans from financial institutions of 4.76 million Baht, repayments of liabilities under lease agreements of 1.66 million Baht, interest payments of 2.70 million Baht and dividend payment of 46.57 million Baht. However, cash flow received from long-term loans from financial institutions of 50 million Baht.
Management Discussion & Analysis (MD&A) Quarter 2/2025
Overview
Operating result according to the consolidated financial statements for the second quarter ended June 30, 2025, Phol Dhanya Public Company Limited (the Company) reported total revenue from sales and services of 247.66 million Baht, increased 10.47 million Baht or 4.42% compared with revenue from sales and services of 237.18 million Baht in the same quarter of previous year.The increase in revenue was primarily driven by the Occupational Safety, Health and Environment products or ‘SAFETY’particularly from higher sales of personal protective equipment, and Medical and Healthcare products, which achieved growth driven by expanding into new product and the expansion of online sales channels. However, revenue from the Control Environment products or ‘CE’and the Water Solution products or ‘WATER’ decreased.
Gross profit increased in line with higher sales revenue, with a higher gross profit margin compared to the same quarter of the previous year. In Q2/2025, the Company reported gross profit of 66.80 million Baht, representing the gross profit margin of 26.97%, with distribution costs and administrative expenses of 50.95 million Baht, an increase compared to the same quarter of the previous year. The Company's operating result for Q2/2025 was report profit before finance costs and income taxes of 20.49 million Baht, representing the profit before finance costs and income taxes margin of 8.15%, increased by 6.87 million Baht or 50.40%, compared to the same quarter of the previous year with profit before finance costs and income taxes of 13.63 million Baht, representing the profit before finance costs and income taxes margin of 5.73%.
However, net profit attributable to shareholders of the parent company for Q2/2025 was 15.10 million Baht, representing a net profit margin of 6.01%, decreased 1.30 million Baht or 7.90% from the same quarter of the previous year, which reported a net profit of 16.40 million Baht, representing a net profit margin of 6.90%. The decline was mainly due to the fact that in Q2/2024, the Company recognized a tax expense reversal from a tax loss arising from the disposal of investments in a subsidiary, whereas in Q2/2025, income tax expenses amounted to 4.40 million Baht.
For the six months period, ending June 30, 2025, the Company reported total revenue from sales and services of 493.96 million Baht decreased 2.53 million Baht or 0.51%, compared to the revenue from sales and services of 496.49 million Baht in the same period of previous year. Gross profit was 132.65 million Baht, representing a gross profit margin of 26.85%, higher than the same period of previous year. In addition, other income amounted to 7.93 million Baht. Distribution Costs increased, while administrative expenses remained comparable to the previous year. As a result, operating profit was 41.64 million Baht, increased 8.41 million Baht or 25.30% compared to the operating profit of 33.23 million Baht in the same period of previous year. Net profit attributable to shareholders of the parent company for the six-month period ended June 30, 2025, was 31.28 million Baht, representing a net profit margin of 6.23%, slightly lower than the previous year’s net profit of 31.95 million Baht, representing a net profit margin of 6.42%, mainly due to the fact that in the previous year, the Company did not incur income tax expenses as it recognized a tax loss arising from the disposal of investments in a subsidiary.
Operating performance
Unit : MB
| Q2/2025 | Q2/2024 | Increased (Decreased) |
% YoY | 1H/2025 | 1H/2024 | Increased (Decreased) |
% YoY | |
|---|---|---|---|---|---|---|---|---|
| Revenue from sales | 243.84 | 231.87 | 11.97 | 5.16% | 488.36 | 481.50 | 6.86 | 1.42% |
| Revenue from rendering of services | 3.82 | 5.31 | (1.50) | -28.16% | 5.61 | 15.00 | (9.39) | -62.62% |
| Total Revenues | 247.66 | 237.18 | 10.47 | 4.42% | 493.96 | 496.49 | (2.53) | -0.51% |
| Cost of sales | (178.17) | (173.05) | 5.12 | 2.96% | (357.37) | (354.27) | 3.10 | 0.87% |
| Cost of services | (2.69) | (3.79) | (1.09) | -28.85% | (3.95) | (11.92) | (7.97) | -66.85% |
| Total Costs | (180.86) | (176.84) | 4.03 | 2.28% | (361.32) | (366.19) | (4.87) | -1.33% |
| Gross Profit | 66.80 | 60.35 | 6.45 | 10.68% | 132.65 | 130.30 | 2.34 | 1.80% |
| Gross Profit Margin (%) | 26.97% | 25.44% | 1.53% | 26.85% | 26.24% | 0.61% | ||
| Other income | 3.80 | 0.49 | 3.30 | 668.42% | 7.93 | 1.50 | 6.43 | 428.58% |
| Distribution costs | (28.76) | (25.52) | 3.25 | 12.72% | (53.62) | (50.18) | 3.43 | 6.84% |
| Administrative expenses | (22.19) | (22.13) | 0.06 | 0.28% | (46.49) | (46.86) | (0.37) | -0.79% |
| Gain (Loss) on exchange rate | 0.86 | 0.43 | 0.43 | 99.77% | 1.17 | (1.53) | (0.37) | -24.01% |
| Profit before finance costs and income taxes | 20.49 | 13.63 | 6.87 | 50.40% | 41.64 | 33.23 | 8.41 | 25.30% |
| Profit before finance costs and income taxes (%) | 8.15% | 5.73% | 2.42% | 8.30% | 6.67% | 1.62% | ||
| Finance costs | (0.99) | (0.74) | 0.26 | 34.69% | (1.80) | (1.49) | 0.31 | 20.50% |
| Share of profit(Loss) form investment in joint ventures | - | (0.01) | (0.01) | -100.00% | - | (0.20) | (0.20) | -100.00% |
| Income tax | (4.40) | 3.51 | 0.89 | 25.21% | (8.56) | 0.40 | 8.15 | 2018.07% |
| Profit attributable to equity holders | 15.10 | 16.40 | (1.30) | -7.90% | 31.28 | 31.95 | (0.67) | -2.10% |
| Net profit margin (%) | 6.01% | 6.90% | -0.89% | 6.23% | 6.42% | -0.18% | ||
| Basic earnings per share (Baht) | 0.07 | 0.08 | (0.01) | -7.90% | 0.15 | 0.16 | (0.003) | -2.10% |
Revenue
Unit : MB
| Q2/2025 | % | Q2/2024 | % | Increased (Decreased) |
% YoY | 1H/2025 | % | 1H/2024 | % | Increased (Decreased) |
% YoY | |
|---|---|---|---|---|---|---|---|---|---|---|---|---|
| Occupational Safety, Health and Environment Products (SAFETY) | 185.18 | 74.77% | 177.81 | 74.97% | 7.37 | 4.14% | 373.72 | 75.66% | 365.78 | 73.67% | 7.93 | 2.17% |
| Control Environment Products (CE) | 41.42 | 16.72% | 42.98 | 18.12% | (1.56) | -3.63% | 81.97 | 16.59% | 89.09 | 17.94% | (7.13) | -8.00% |
| Water Solution Products (WATER) | 8.06 | 3.25% | 9.61 | 4.05% | (1.56) | -16.22% | 12.95 | 2.62% | 29.29 | 5.90% | (16.34) | -55.79% |
| Medical and Healthcare Products | 13.00 | 5.25% | 6.78 | 2.86% | 6.22 | 91.83% | 25.33 | 5.13% | 12.33 | 2.48% | 13.00 | 105.49% |
| Total revenue from sales and services | 247.66 | 100% | 237.18 | 100% | 10.47 | 4.42% | 493.96 | 100% | 496.49 | 100% | (2.53) | -0.51% |
In Q2/2025, the total revenue from sales and services provision were 247.66 million Baht, with 185.18 million Baht of Occupational Safety, Health and Environment Products or ‘SAFETY’ accounting for 74.77%, 41.42 million Baht of Control Environment Products or ‘CE’ accounting for 16.72%, 8.06 million Baht of Water Solution Products or ‘WATER’ accounting for 3.25%, and 13 million Baht of Medical and Healthcare Products accounting for 5.25%.
The revenue from sales and services provision in SAFETY products was 185.18 million Baht, increase by 7.37 million Baht or 4.14% compared to the same quarter of the previous year. The increase was mainly driven by higher sales of personal protective equipment, as the company launched new product models, especially in the safety shoe category, under the Company’s own ROCC brand, as well as in the premium safety shoe category, leading to higher sales from both existing and new customers in the industrial sector. In addition, the development of online and telesales channels, resulted in increased sales form SME customers and individual consumers.
The revenue from sales and services provision in CE products was 41.42 million Baht, decreased 1.56 million Baht or 3.63% compared to the same quarter of the previous year. Major customers in the electronics parts manufacturing industry have decreased production according to the slowdown in the electronics industry, especially the solar cell manufacturing. However, the company has added new products, resulting in increased sales among new customers.
The revenue from sales and services provision in the WATER products was 8.06 million Baht, decrease by 1.56 million Baht or 16.22% compared to the same quarter of the previous year. The significant decline in revenue was primarily due to the lower sales of machinery and equipment, as well as, a reduction in revenue from construction project contracts for water treatment systems, compared to the same period of the previous year.
The revenue from sales provision in Medical and Healthcare Products was 13 million Baht increased 6.22 million Baht or 91.83% compared to the same quarter of the previous year, mainly from new products marketing in the medical and hospital equipment and healthcare products, including adult diaper, with sales revenue increased both from government agencies procurement and sales through online channels.
Other Income
In Q2/2025, the Company reported other income of 3.80 million Baht, an increase compared to the same quarter of the previous year. The increase in other income was mainly due to the receipt of fines and fees from water treatment projects that end of the lawsuit.
Cost of Sales and Services
In Q2/2025, The Company reported total costs of 180.86 million Baht, comprising cost of sales of 178.17 million Baht and cost of services of 2.69 million Baht. Cost of sales and services increased by 4.03 million Baht or 2.28%, Cost of sales increased in line with higher revenue from sales and cost of services decreased in line with lower revenue from services. The cost of sales and services represented 73.03 of total revenue from sales and services, resulting in the gross profit of 66.80 million Baht, equivalent to a gross profit margin of 26.97%. Gross profit increased 6.45 million Baht or 10.68%, in line with more revenue from sales and new products offering, compared to gross profit of 60.35 million Baht, equivalent to a gross profit margin of 25.44% in the same quarter of the previous year.
Distribution Costs and Administrative Expenses
In Q2/2025, Distribution costs and administrative expenses amounted to 50.95 million Baht, consisting distribution costs of 28.76 million Baht and administrative expenses of 22.19 million Baht. Distribution costs increased primarily driven by higher advertising and promotion expenses, marketing expenses and fees associated with various online sales channels, however, travel and transportation expenses decreased and administrative expenses were similar to the same quarter of the previous year.
Financial cost amounted to 0.99 million Baht, increased 0.26 million Baht or 34.69% compared to financial cost of 0.74 million Baht in the same quarter of previous year, mainly due to higher long-term loan from financial institutions.
Income Tax
In Q2/2025, income tax expense of the Company was 4.40 million Baht, while, there was a reversal of income tax expenses of 3.51 million baht in Q2/2024, mainly due to the fact that in the previous year, the Company did not incur income tax expenses as it recognized a tax loss arising from the disposal of investments in a subsidiary.
Profit before finance costs and income taxes and Net Profit
In Q2/2025, the Company reported profit before finance costs and income taxes of 20.49 million Baht, representing the profit before finance costs and income taxes margin of 8.15%, increased by 6.87 million Baht or 50.40%, compared to the same quarter of the previous year with profit before finance costs and income taxes of 13.63 million Baht, representing the profit before finance costs and income taxes margin of 5.73%. However, net profit attributable to equity holders of 15.10 million Baht, representing the net profit margin of 6.01%, decreased 1.30 million Baht or 7.90%, compared to net profit attributable to equity holders of 16.40 million Baht, representing the net profit margin of 6.90% in the same quarter of previous year. The decline was mainly due to the fact that in Q2/2024, the Company recognized a tax expense reversal from a tax loss arising from the disposal of investments in a subsidiary, whereas in Q2/2025, income tax expenses amounted to 4.40 million Baht.
Financial Position
Unit : MB
| June 30, 2025 | December 31, 2024 | Increased (Decreased) |
% Change | |||
|---|---|---|---|---|---|---|
| Amount | % | Amount | % | |||
| Current Assets | 500.93 | 75.52% | 488.47 | 75.03% | 12.46 | 2.55% |
| Non Current Assets | 162.37 | 24.48% | 162.54 | 24.97% | (0.17) | -0.10% |
| Total Assets | 663.30 | 100.00% | 651.01 | 100.00% | 12.29 | 1.89% |
| Current Liabilities | 184.69 | 27.85% | 219.15 | 33.67% | (34.46) | -15.73% |
| Non Current Liabilities | 77.82 | 11.73% | 36.25 | 5.57% | 41.57 | 114.67% |
| Total Liabilities | 262.51 | 39.58% | 255.4 | 39.24% | 7.11 | 2.78% |
| Shareholder's Equity of the Company | 400.67 | 60.42% | 395.49 | 60.76% | 5.19 | 1.31% |
Assets
As of June 30, 2025, the Company reported total assets of 663.30 million Baht, increased 12.29 million Baht or 1.89% from December 31, 2024. The increase in total assets was mainly from current assets, which increased of 12.46 million Baht or 2.55% from cash and cash equivalents increased 3.40 million Baht, trade and other current receivables-net increased 11.60 million Baht. However, net-inventories decreased 0.71 million Baht and income tax assets for the current period decreased 1.09 million Baht.
Liabilities
As of June 30, 2025, the Company reported total liabilities of 262.51 million Baht, increased of 7.11 million Baht or 2.78% from December 31, 2024. The increase in total liabilities was mainly from non-current liabilities, due to the increased of long-term loans from financial institutions 39.89 million baht to provide working capital and enhance the Company's financial liquidity and provision of employee benefits increased 1.60 million Baht. Current liabilities decreased mainly from the decrease of 23.21 million Baht of short-term loans from financial institutions and trade and other payables decreased 23.27 million Baht. However, current portion of long-term loans from financial institutions increased 7.14 million Baht and current income tax payable increased 5.75 million Baht.
Shareholder’s equity
As of June 30, 2025, the Company reported shareholders’ equity of 400.67 million Baht, increased of 5.19 million Baht or 1.31% from December 31, 2024 from profit for the period of 31.51 million Baht. However, shareholders’ equity decreased from dividend payment of 26.32 MB.
Cash Flows
Unit : MB
| Cash Flows | June 30, 2025 | June 30, 2024 |
|---|---|---|
| Cash flow from (used in) operating activities | 9.13 | 13.54 |
| Cash flow from (used in) investing activities | (0.55) | 5.17 |
| Cash flow from (used in) financing activities | (5.41) | (20.91) |
| Net increase (decrease) in cash and cash equivalents | 3.17 | (2.20) |
| Cash and cash equivalents at beginning of the period | 58.33 | 61.68 |
| Cash and cash equivalents at the end of the period | 61.73 | 59.38 |
For the six month period, ended June 30, 2025, the Company’s net cash from operating activities of 9.13 million Baht, with operating profits prior to changes in the operating assets and liabilities of 50.81 million Baht. Cash flow decreased mainly from trade and other receivables increased 11.77 million Baht, net-inventories increased 1.99 million Baht, payment of trade and other current payables of 23.50 million Baht and payment of income tax of 4.42 million baht.
Cash flow used in investment activities of 0.55 million Baht to purchase office equipment of 1.44 million Baht and short-term loans to joint ventures of 0.37 million Baht. However, cash flow acquired from received repayment of loans to joint ventures of 1 million Baht and interest receive of 0.43 million Baht.
Cash flow used in financing activities of 5.41 million Baht, to payments of short-term loans from financial institutions of 23.21 million Baht, repayments of long-term loans from financial institutions of 2.98 million Baht, repayments of liabilities under lease agreements of 1.10 million Baht, interest payments of 1.80 million Baht and dividend payment of 26.32 million Baht. However, cash flow received from long-term loans from financial institutions of 50 million Baht.
Management Discussion & Analysis (MD&A) Quarter 1/2025
Overview
Operating result according to the consolidated financial statements for the first quarter ended March 31, 2025, Phol Dhanya Public Company Limited (the Company) reported total revenue from sales and services of 246.31 million Baht, decreased 13.01 million Baht or 5.02% compared with revenue from sales and services of 259.31 million Baht in the same quarter of previous year. The decreased in total revenue was mainly due to a decrease in sales from the Control Environment products or ‘CE’, which was impacted by the continued slowdown in the industry of main customers in electronic. Additionally, revenue from sales and services from Water Solution products or ‘WATER’ declined due to the project-based nature of the business. However, Occupational Safety, Health and Environment products or ‘SAFETY’ and Medical and Healthcare products had revenue growth driven by expanding into new product markets. Gross profit decreased in line with the lower revenue from sales and services, in quarter 1/2025, the Company reported gross profit of 65.94 million Baht, representing the gross profit margin of 26.74%, with distribution costs and administrative expenses of 49.15 million Baht, a decrease compared to the same quarter of the previous year. In addition, other income of 4.14 million Baht, an increase from the same period of last year.
In quarter 1/2025, the Company’s net profit was 16.18 million Baht, equivalent to net profit margin of 6.46%, increased 0.63 million Baht or 4.07% compared to the same quarter of the previous year with net profit of 15.55 million Baht, equivalent to net profit margin of 5.97%.
Operating performance
Unit : MB
| Q1/2025 | Q1/2024 | Increased (Decreased) |
% YoY | |
|---|---|---|---|---|
| Revenue from sales | 244.52 | 249.63 | (5.11) | -2.05% |
| Revenue from rendering of services | 1.79 | 9.68 | (7.89) | -81.52% |
| Total Revenues | 246.31 | 259.31 | (13.01) | -5.02% |
| Cost of sales | (179.20) | (181.22) | (2.02) | -1.12% |
| Cost of services | (1.26) | (8.14) | (6.88) | -84.53% |
| Total Costs | (180.46) | (189.36) | (8.90) | -4.70% |
| Gross Profit | 65.85 | 69.96 | (4.11) | -5.87% |
| Gross Profit Margin (%) | 26.74% | 26.98% | -0.24% | |
| Other income | 4.14 | 1.01 | 3.13 | 310.92% |
| Distribution costs | (24.85) | (24.67) | 0.19 | 0.76% |
| Administrative expenses | (24.30) | (24.73) | (0.43) | -1.75% |
| Gain (Loss) on exchange rate | 0.31 | (1.96) | 2.27 | 115.81% |
| Profit before finance costs and income taxes | 21.15 | 19.61 | 1.54 | 7.86% |
| Profit before finance costs and income taxes (%) | 8.44% | 7.53% | 0.91% | |
| Finance costs | (0.81) | (0.76) | 0.05 | 6.73% |
| Share of profit(Loss) form investment in joint ventures | - | (0.19) | (0.19) | -100.00% |
| Income tax | (4.16) | (3.11) | 1.05 | 33.67% |
| Profit attributable to equity holders | 16.18 | 15.55 | 0.63 | 4.07% |
| Net profit margin (%) | 6.46% | 5.97% | 0.49% | |
| Basic earnings per share (Baht) | 0.08 | 0.08 | 0.003 | 4.07% |
Revenue
Unit : MB
| Q1/2025 | % | Q1/2024 | % | Increased (Decreased) |
% YoY | |
|---|---|---|---|---|---|---|
| Occupational Safety, Health and Environment Products (SAFETY) | 188.53 | 76.54% | 187.97 | 72.49% | 0.56 | 0.30% |
| Control Environment Products (CE) | 40.55 | 16.46% | 46.11 | 17.78% | (5.56) | -12.07% |
| Water Solution Products (WATER) | 4.90 | 1.99% | 19.68 | 7.59% | (14.78) | -75.12% |
| Medical and Healthcare Products | 12.33 | 5.00% | 5.55 | 2.14% | 6.78 | 122.17% |
| Total revenue from sales and services | 246.31 | 100% | 259.31 | 100% | (13.01) | -5.02% |
In quarter 1/2025, the total revenue from sales and services provision were 246.31 million Baht, with 188.53 million Baht of Occupational Safety, Health and Environment Products or ‘SAFETY’ accounting for 76.54%, 40.55 million Baht of Control Environment Products or ‘CE’ accounting for 16.46%, 4.90 million Baht of Water Solution Products or ‘WATER’ accounting for 1.99%, and 12.33 million Baht of Medical and Healthcare Products accounting for 5%.
The revenue from sales and services provision in SAFETY products was 188.53 million Baht, increased 0.56 million Baht or 0.30% compared to the same quarter of the previous year. Revenue from sales of personal protective equipment products increased, as the company launched new product models, especially in the safety shoe category, under the ROCC brand, which is the company's product own brand, as well as in the premium safety shoe category, leading to higher sales from both existing and new customers in the industrial sector. In addition, the development of online and telesales channels, resulted in increased sales form SME and individual customers.
The revenue from sales and services provision in CE products was 40.55 million Baht, decreased 5.56 million Baht or 12.07% compared to the same quarter of the previous year. Major customers in the electronics parts manufacturing industry have decreased production according to the slowdown in the electronics industry, especially the solar cell manufacturing.
The revenue from sales and services provision in the WATER products was 4.90 million Baht, decreased 14.78 million Baht or 75.12% compared to the same quarter of the previous year. The significant decline in revenue was primarily due to the revenue from sale machinery and equipment to a joint venture’s projects that occurred in the previous year.
The revenue from sales provision in Medical and Healthcare Products was 12.33 million Baht increased 6.78 million Baht or 122.17% compared to the same quarter of the previous year, mainly from new products marketing in the medical and hospital equipment and healthcare products, including adult diaper, with sales revenue increased from sales to government agencies and sales through online channels.
Other Income
In quarter 1/2025, the Company reported other income of 4.14 million Baht, an increase compared to the same quarter of the previous year. The increase in other income was mainly due to the receipt of fines and fees from water treatment projects that end of the lawsuit, as well as rebate refunds from suppliers
Cost of Sales and Services
In quarter 1/2025, The Company reported total costs of 180.46 million Baht, comprising cost of sales of 179.20 million Baht and cost of rendering of services of 1.26 million Baht. Cost of sales and services decreased 8.90 million Baht or 4.70% in line with lower revenue from sales and services. The cost of sales and services represented 73.26% of total revenue from sales and services, resulting in the gross profit of 65.85 million Baht, equivalent to a gross profit margin of 26.74%. Gross profit decreased 4.11 million Baht or 5.87% compared to gross profit of 69.96 million Baht, equivalent to a gross profit margin of 26.98% in the same quarter of the previous year.
Distribution Costs and Administrative Expenses
In quarter 1/2025, Distribution costs and administrative expenses amounted to 49.15 million Baht, consisting distribution costs of 24.85 million Baht and administrative expenses of 24.30 million Baht. Total distribution costs and administrative expenses decreased slightly compared to the same quarter of the previous year. The increase in distribution costs was primarily driven by higher advertising and promotion expenses, marketing expenses and fees associated with various online sales channels, however, travel and transportation expenses decreased. Administrative expenses increased mainly from legal fees, while employee welfare expenses declined, as the previous year included the distribution of products as part of employee welfare.
In quarter 1/2025, the company reported gain on exchange rate of 0.31 million Baht, while there was loss on exchange rate of 1.96 million Baht in the same quarter of the previous year.
Financial cost amounted to 0.81 million Baht, increased 0.05 million Baht or 6.73% compared to financial cost of 0.76 million Baht in the same quarter of previous year, mainly due to higher long-term loan from financial institutions.
Net Profit
In quarter 1/2025, the company reported net profit attributable to equity holders of 16.18 million Baht, representing the net profit margin of 6.46%, increased 0.63 million Baht or 4.07%, compared to net profit attributable to equity holders of 15.55 million Baht, representing the net profit margin of 5.97% in the same quarter of previous year.
Financial Position
Unit : MB
| March 31, 2025 | December 31, 2024 | Increased (Decreased) |
% Change | |||
|---|---|---|---|---|---|---|
| Amount | % | Amount | % | |||
| Current Assets | 536.88 | 76.73% | 488.47 | 75.03% | 48.41 | 9.91% |
| Non Current Assets | 162.82 | 23.27% | 162.54 | 24.97% | 0.29 | 0.18% |
| Total Assets | 699.70 | 100.00% | 651.01 | 100.00% | 48.69 | 7.48% |
| Current Liabilities | 209.35 | 29.93% | 219.15 | 33.67% | (9.80) | -4.47% |
| Non Current Liabilities | 78.56 | 11.23% | 36.25 | 5.57% | 42.30 | 116.70% |
| Total Liabilities | 287.91 | 41.15% | 255.40 | 39.24% | 32.51 | 12.73% |
| Shareholder's Equity of the Company | 411.67 | 58.85% | 395.49 | 60.76% | 16.18 | 4.09% |
Assets
As of March 31, 2025, the Company reported total assets of 699.70 million Baht, increased of 48.69 million Baht or 7.48% from December 31, 2024. The increase in total assets was mainly from current assets, which increased of 48.41 million Baht or 9.91% from cash and cash equivalents increased 34.40 million Baht, trade and other current receivables-net increased 11.31 million Baht and net-inventories increased 3.86 million Baht. However, income tax assets for the current period decreased 1.01 million Baht.
Liabilities
As of March 31, 2025, the Company reported total liabilities of 287.91 million Baht, increased of 32.51 million Baht or 12.73% from December 31, 2024. The increase in total liabilities was mainly from non-current liabilities, due to the increased of long-term loans from financial institutions 41.67 million baht to provide working capital and enhance the Company's financial liquidity. Current liabilities decreased mainly from the decrease of 11.70 million Baht of short-term loans from financial institutions and trade and other payables decreased 9.24 million Baht. However, current portion of long-term loans from financial institutions increased 7.14 million Baht and current income tax payable increased 4.54 million Baht.
Shareholder’s equity
As of March 31, 2025, the Company reported shareholders’ equity of 411.67 million Baht, increased of 16.18 million Baht or 4.09% from December 31, 2024 from net profit for the period.
Cash Flows
Unit : MB
| Cash Flows | March 31, 2025 | March 31, 2024 |
|---|---|---|
| Cash flow from (used in) operating activities | -0.64 | 1.54 |
| Cash flow from (used in) investing activities | -0.71 | -0.36 |
| Cash flow from (used in) financing activities | 35.75 | -12.16 |
| Net increase (decrease) in cash and cash equivalents | 34.4 | -10.98 |
| Cash and cash equivalents at beginning of the period | 58.33 | 61.68 |
| Cash and cash equivalents at the end of the period | 92.73 | 50.62 |
For the three month period, ended March 31, 2025, the Company’s net cash used in operating activities of 0.64 million Baht, with operating profits prior to changes in the operating assets and liabilities of 25.52 million Baht. Cash flow decreased mainly from trade and other receivables increased 11.41 million Baht, net-inventories increased 5.26 million Baht and payment of trade and other current payables of 9.09 million Baht.
Cash flow used in investment activities of 0.71 million Baht to purchase office equipment of 0.82 million Baht and purchase intangible assets of 0.04 million Baht. However, cash flow acquired from interest receive of 0.12 million Baht and received repayment of loans to employees of 0.04 million Baht.
Cash flow increased from financing activities of 35.75 million Baht, mainly received from long-term loans from financial institutions of 50 million Baht. However, cash decreased from repayments of short-term loans from financial institutions of 11.70 million Baht, repayments of long-term loans from financial institutions of 1.19 million Baht, repayments of liabilities under lease agreements of 0.55 million Baht, and interest payments of 0.81 million Baht.
Management Discussion & Analysis (MD&A) Yearly 2024
Overview
Referring to the operating performance in the consolidated financial statement for the year, ending December 31, 2024, Phol Dhanya PCL (the Company)’s total revenue from sales and services were 1,014.54 MB, increased by 43.11 MB or 4.44%, compared with revenue from sales and services of 971.43 MB in the previous year, mainly from Occupational Safety, Health and Environment Products or ‘SAFETY’ increased from sales in the personal protective equipment and revenue from Water Solution Products or WATER were increase due to the number of construction projects, water treatment system installation services and revenue from selling products, machinery and equipment increased compared to the previous year. In addition, the Company had revenue from Medical and Healthcare Products increase from expanding into new product markets. However, revenue from Control Environment Products or ‘CE’ decreased due to the slowdown in the industry of main customers in electronic.
In 2024, the company’s gross profit was 259.32 MB, representing gross profit margin of 25.56% Gross profit was similar to the previous year, however, gross profit margin decreased, mainly due to the lower gross profit in the rubber glove and nitrile glove in line with market prices, in addition, the proportion of sales to government sector increased, which did not have high gross profit margin, resulting in a decrease in the overall average gross profit margin. Distribution costs and administrative expenses were similar to the previous year and lower tax expenses because the Company has restructured of the shareholding structure in the subsidiaries to enhance the managerial efficiency within the group, by divesting the investment capital in a subsidiary in the group of the Company, resulting a loss from the divestment to a corporate income tax calculation resulted in lower tax expenses in 2024.
For the Year 2024, the Company’s consolidated net profit attributable to equity holders of 65.69 MB, representing a net profit margin of 6.44%, increased 7.39 MB or 12.68% compared to the net profit attributable to equity holders of 58.30 MB, representing net profit margin of 6.09% in previous year.
Operating performance
Unit : MB
| Y2024 | Y2023 | Increased (Decreased) |
% YoY | |
|---|---|---|---|---|
| Revenue from sales | 978.55 | 950.14 | 28.41 | 2.99% |
| Revenue from rendering of services | 35.98 | 21.28 | 14.70 | 69.09% |
| Total Revenues | 1,014.54 | 971.43 | 43.11 | 4.44% |
| Cost of sales | (726.13) | (698.00) | 28.13 | 4.03% |
| Cost of services | (29.09) | (14.76) | 14.33 | 97.07% |
| Total Costs | (755.21) | (712.76) | 42.45 | 5.96% |
| Gross Profit | 259.32 | 258.67 | 0.66 | 0.25% |
| Gross Profit Margin (%) | 25.56% | 26.63% | -1.07% | |
| Other income | 4.88 | 10.01 | (5.12) | -51.20% |
| Total distribution costs and administrative expenses | (194.17) | (194.80) | (0.63) | -0.33% |
| Gain on exchange rate | 1.95 | 1.50 | 0.45 | 29.94% |
| Profit before finance costs and income taxes | 71.99 | 75.37 | (3.38) | -4.49% |
| Profit before finance costs and income taxes (%) | 7.06% | 7.68% | -0.62% | |
| Financial Costs | (3.17) | (2.40) | 0.77 | 31.92% |
| Share of profit(Loss) form investment in joint ventures | (0.07) | 0.92 | (0.85) | -92.27% |
| Income tax expenses | (3.06) | (14.17) | (11.11) | -78.43% |
| Profit attributable to equity holders | 65.69 | 58.30 | 7.39 | 12.68% |
| Net profit margin (%) | 6.44% | 6.09% | 0.36% | |
| Basic earnings per share (Baht) | 0.32 | 0.29 | 0.03 | 12.68% |
Revenue
Unit : MB
| Y2024 | % | Y2023 | % | Increased (Decreased) |
% | |
|---|---|---|---|---|---|---|
| Occupational Safety, Health and Environment Products (SAFETY) | 742.11 | 73.15% | 713.67 | 73.47% | 28.44 | 3.98% |
| Control Environment Products (CE) | 178.55 | 17.60% | 213.33 | 21.96% | (34.78) | -16.30% |
| Water Solution Products (WATER) | 56.17 | 5.54% | 32.25 | 3.32% | 23.92 | 74.16% |
| Medical and Healthcare Products | 37.71 | 3.72% | 12.17 | 1.25% | 25.54 | 209.89% |
| Total revenue from sales and services | 1,014.54 | 100% | 971.43 | 100% | 43.11 | 4.44% |
In 2024, the total revenue from sales and services provision were 1,014.54 MB, with 742.11 MB of Occupational Safety, Health and Environment Products or ‘SAFETY’ accounting for 73.15%, 178.55 MB of Control Environment Products or ‘CE’ accounting for 17.60%, 56.17 MB of Water Solution Products or ‘WATER’ accounting for 5.54%, and 37.71 MB of Medical and Healthcare Products accounting for 3.72%.
The revenue from sales and services provision in SAFETY products was reported at 742.11 MB, increased by 28.44 MB or 3.98% YoY mainly from revenue from sales of personal protective equipment increased, as the Company has developed new product models, leading to higher sales both from existing and new customers in the industrial sector, as well as from the development of online and tele-sales channels, boosting sales from SMEs and individual customers. However, revenue decreased form products in the rubber gloves and nitrile gloves, in line with the decrease in market prices. Sales revenue of the technical and engineering product for safety workplace increased compare to the previous year.
The revenue from sales and services provision in CE products was 178.55 MB, decreased by 34.78 MB or 16.30% YoY. Major customers in the electronics industry have decreased production according to the slowdown in the electronics industry. In addition, revenue also decreased from the selling price of glove category. However, the company has expanded its customer to the food and beverage industry and pharmaceutical industry, resulting in the increase in sales revenue from new customers.
The revenue from sales and services provision in the WATER products was 56.17 MB, increased by 23.92 MB or 74.16% YoY, mainly due to the number of construction projects and water treatment system installation services increased both in the industrial sector and government agencies compared to the previous year, and more sales revenue from related products, machinery and equipment.
The revenue from sales provision in Medical and Healthcare Products was 37.71 MB increased by 25.54 MB or 209.89% YoY, mainly from new product marketing in the medical and hospital equipment and healthcare products, including adult diaper and ergonomic equipment, with sales revenue increased from sales to government agencies and sales through online channels.
Other Income
In 2024, the Company had other income of 4.88 MB, mainly from debt repayment and refunds fines and fees from water treatment system projects that end of the lawsuit which decreased compared to other income of 10.01 MB in the previous year.
Cost of Sales and Services
In 2024, the Company’s total costs were 755.21 MB, comprising of 726.13 MB cost of sales and 29.09 MB cost of rendering of services. Cost of sales and services increased 42.45 MB or 5.96% YoY, proportionally with higher revenue from sales and services. Costs of sales and services accounted for 74.44% of revenue from sales and services.
Resulted in the Company’s gross profit of 259.32 MB, representing gross profit margin of 25.56%, gross profit was similar to the previous year, however, gross profit margin decreased, compare to gross profit of 258.67 MB, representing gross profit margin of 26.63% in the previous year, mainly due to the lower gross profit in the rubber glove and nitrile glove in line with market prices, in addition, the proportion of sales to government sector increased, which did not have high gross profit margin, resulting in a decrease in the overall average gross profit margin.
Distribution Costs and Administrative Expenses
In 2024, Distribution costs and administrative expenses were 194.17 MB, consisting distribution costs of 100.63 MB and administrative expenses of 93.54 MB.
Distribution costs and administrative expenses were similar compared to the previous year, decreasing by 0.63 MB or 0.33%, with the decrease mainly from employee expenses. Meanwhile, marketing expenses, advertising and promotion expenses and transportation expenses were increase.
In 2024, the company had the gain on exchange rate-net of 1.95 MB, increased by 0.45 MB compared to gain on exchange rate-net of 1.50 MB in the previous year.
The company’s financial cost was 3.17 MB, increased by 0.77 MB or 31.92% compared to financial cost of 2.40 MB in the previous year due to the higher use of short-term loans from financial institutions.
Income Tax Expense
In 2024, the Company had income tax expenses of 3.06 MB, decreased by 11.11 MB compare to income tax expenses of 14.17 MB in the previous year, due to the Company has restructured of the shareholding structure in the subsidiaries to enhance the managerial efficiency within the group during the year, by divesting the investment capital in a subsidiary; Phol Entech (formerly Phol Water Co., Ltd.) to another subsidiary; Phol Palladium. Such divestment does not have any impact on the operating results as shown in the consolidated statement of financial, though a loss was incurred from the divestment following a corporate income tax calculation, resulting in a lower income tax expense.
Net Profit
In 2024, the company’s consolidate net profit attributable to equity holders was 65.69 MB, accounted for net profit margin 6.44%, increasing by 7.39 MB or 12.68% compared to net profit attributable to equity holders of 58.30 MB, accounted for net profit margin 6.09% in the previous year.
Financial Position
Unit : MB
| December 31, 2024 | December 31, 2023 | Increased (Decreased) |
% Change | |||
|---|---|---|---|---|---|---|
| Amount | % | Amount | % | |||
| Current Assets | 488.47 | 75.03% | 468.44 | 72.81% | 20.03 | 4.28% |
| Non-Current Assets | 162.54 | 24.97% | 174.95 | 27.19% | (12.41) | -7.09% |
| Total Assets | 651.01 | 100.00% | 643.39 | 100.00% | 7.62 | 1.18% |
| Current Liabilities | 219.15 | 33.67% | 234.39 | 36.44% | (15.24) | -6.50% |
| Non-Current Liabilities | 36.25 | 5.57% | 34.60 | 5.38% | 1.65 | 4.77% |
| Total Liabilities | 255.40 | 39.24% | 268.99 | 41.82% | (13.59) | -5.05% |
| Shareholder's Equity of the Company | 395.49 | 60.76% | 374.28 | 58.18% | 21.21 | 5.67% |
Assets
As of December 31, 2024, the Company’s total assets were 651.01 MB, increased by 7.62 MB or 1.18% from December 31, 2023. The increase in assets was mainly due to an increase in current assets of 20.03 MB or 4.28%, mainly from trade and other current receivables increased 9.62MB, net-inventories increased 11.39 MB, and short-term loan to joint venture partner increased 2 MB, while, cash and cash equivalents decreased 3.35 MB.
Non-current assets decreased by 12.41 MB or 7.09%, mainly from investment in joint ventures decreased 7.82 MB, due to returned of investment in the joint venture. Property, plant and equipment-net decreased mainly from depreciation for the period of 7.34 MB, however, fix assets increase in the purchase of operating assets of 1.75 MB and the installation of a Solar Rooftop power generation system of 1.59 MB.
Liabilities
As of December 31, 2024, the Company’s total liabilities were 255.40 MB, decreased by 13.59 MB or 5.05% from December 31, 2023. The decrease in liabilities was mainly due to a decrease in current liabilities, which decreased mainly from short-term loans from financial institutions decreased 15.97 MB and current income tax payable decreased 2.26 MB. However, trade and other current payables increased 2.57 MB. Non-current liabilities increased mainly due to an increase in provisions for employee benefit liabilities of 3.03 MB.
Shareholder’s equity
As of December 31, 2024, Shareholders’ equity of the Company was 395.49 MB, increased 21.21 MB or 5.67% from December 31, 2023. Shareholders’ equity increased from 65.69 MB of net profit for the period, while shareholders’ equity decreased from dividend payment of 44.54 MB.
Cash Flows
Unit : MB
| Cash Flows | December 31, 2024 | December 31, 2023 |
|---|---|---|
| Cash flow from (used in) operating activities | 59.34 | 68.08 |
| Cash flow from (used in) investing activities | 3.33 | 0.71 |
| Cash flow from (used in) financing activities | (66.09) | (60.68) |
| Net increase (decrease) in cash and cash equivalents | (3.42) | 8.12 |
| Cash and cash equivalents at the end of the period | 58.33 | 61.68 |
For the year, ending December 31, 2024, the Company’s net cash from the operating activities was 59.34 MB, with operating profits prior to changes in the operating assets and liabilities of 89.94 MB. Cash flow decreased from trade and other receivables increased 10.03 MB, inventories increased 15.78 MB, payment of trade and other current payables of 1.17 MB and payment of income tax of 7.38 MB. However, cash flow received from income tax refund of 1.42 MB.
Cash flow from investment activities was 3.33 MB mainly from the return of investment in a joint ventures of 8 MB and interest received of 0.49 MB. While, cash flow decreased from short-term loan to joint venture partner of 2 MB and purchase fix assets of 3.34 MB.
Cash flow used in financing activities was 66.09 MB to payment of short-term loan from financial institutions of 15.97 MB, repayment of liabilities under lease agreement of 2.51 MB, interest expense of 3.07 MB and dividend payment of 44.54 MB.
Management Discussion & Analysis (MD&A) Quarter 3/2024
Overview
| Q3/2024 | Q3/2023 | Increased (Decreased) |
% YoY | 9M/2024 | 9M/2023 | Increased (Decreased) |
% YoY | |
|---|---|---|---|---|---|---|---|---|
| Revenue from sales | 255.68 | 243.06 | 12.62 | 5.19% | 737.18 | 713.57 | 23.61 | 3.31% |
| Revenue from rendering of services | 9.82 | 7.57 | 2.24 | 29.59% | 24.81 | 17.00 | 7.81 | 45.94% |
| Total revenues | 265.50 | 250.64 | 14.86 | 5.93% | 761.99 | 730.57 | 31.42 | 4.30% |
| Cost of sales | (194.77) | (178.85) | 15.93 | 8.90% | (549.04) | (522.44) | 26.60 | 5.09% |
| Cost of services | (7.81) | (5.71) | 2.10 | 36.83% | (19.73) | (12.69) | 7.03 | 55.40% |
| Total costs | (202.58) | (184.55) | 18.03 | 9.77% | (568.77) | (535.13) | 33.64 | 6.29% |
| Gross profit | 62.92 | 66.09 | (3.17) | -4.80% | 193.22 | 195.44 | (2.21) | -1.13% |
| Gross profit margin (%) | 23.70% | 26.37% | -2.67% | 25.36% | 26.75% | -1.39% | ||
| Other income | 0.88 | 1.46 | (0.58) | -39.99% | 2.38 | 5.29 | (2.91) | -55.04% |
| Total distribution costs and administrative expenses | (47.70) | (48.85) | (1.16) | -2.37% | (144.73) | (146.83) | (2.09) | -1.43% |
| Gain (Loss) on exchange rate | 4.23 | (0.41) | 4.65 | 1122.71% | 2.70 | (1.56) | 1.14 | 73.25% |
| Profit before finance costs and income taxes | 20.33 | 18.28 | 2.05 | 11.23% | 53.56 | 52.33 | 1.23 | 2.35% |
| Profit before finance costs and income taxes (%) | 7.63% | 7.25% | 0.38% | 7.01% | 7.11% | -0.10% | ||
| Finance costs | (0.90) | (0.56) | 0.34 | 60.36% | (2.39) | (1.64) | 0.75 | 46.06% |
| Share of profit(Loss) form investment in joint ventures | 0.07 | 0.20 | (0.13) | -64.14% | (0.13) | 1.00 | (0.88) | -87.43% |
| Income tax | (0.15) | (3.29) | (3.14) | -95.32% | 0.25 | (10.37) | (10.12) | -97.59% |
| Profit attributable to equity holders | 19.35 | 14.62 | 4.73 | 32.31% | 51.30 | 41.33 | 9.97 | 24.11% |
| Net profit margin (%) | 7.26% | 5.80% | 1.46% | 6.71% | 5.62% | 1.09% | ||
| Basic earnings per share (Baht) | 0.10 | 0.07 | 0.02 | 32.31% | 0.25 | 0.20 | 0.05 | 24.11% |
Referring to the operating performance in the consolidated financial statement for the third quarter, ending September 30, 2024, Phol Dhanya PCL (the Company)’s total revenue from sales and services were 265.50 MB, increased by 14.86 MB or 5.93%, compared with revenue from sales and services of 250.64 MB in the same quarter of previous year, mainly from sales revenue in the Occupational Safety, Health and Environment Products or ‘SAFETY’ and Medical and Healthcare Products, however, sales revenue from Control Environment Products or ‘CE’ decreased due to the slowdown in the industry of main customers in electronic segment. Revenue from sales and services in the Water Solution Products or ‘WATER’ increased from the construction projects and revenue from selling related products and equipment.
In quarter 3/2024, the company’s gross profit was 62.92 MB, representing gross profit margin of 23.70%, gross profit decreased by 3.17 MB or 4.80% YoY, due to the lower gross profit in the rubber glove and nitrile glove in line with market prices, in addition, the proportion of sales to government sector increased, which did not have high gross profit margin, resulting in a decrease in the overall average gross profit margin. Distribution costs and administrative expenses were 47.70 MB, decreased by 1.16 MB or 2.37% YoY. And the company had the gain on exchange rate of 4.23 MB in quarter 3/2024, as the result, the Company’s net profit attributable to equity holders was 19.35 MB, representing net profit margin of 7.26%, net profit increased by 4.73 MB or 32.31% compared to the net profit of 14.62 MB, representing net profit margin of 5.80% in the same quarter of previous year.
For the nine months period, ending September 30, 2024, the Company’s total revenue from sales and services were 761.99 MB, increased by 31.42 MB or 4.30% compared to the revenue from sales and services of 730.57 MB in the same period of previous year. The Company’s consolidated net profit attributable to equity holders of 51.30 MB, representing a net profit margin of 6.71%, increased by 9.97 MB or 24.11% compared to the net profit of 41.33 MB, representing net profit margin of 5.62% in the same period of previous year.
Revenue from Sales and Services
Unit : MB
| Q3/2024 | % | Q3/2023 | % | Increased (Decreased) |
% YoY | 9M/2024 | % | 9M/2023 | % | Increased (Decreased) |
% YoY | |
|---|---|---|---|---|---|---|---|---|---|---|---|---|
| Occupational Safety, Health and Environment Products (SAFETY) | 192.27 | 72.42% | 182.23 | 72.71% | 10.04 | 5.51% | 558.05 | 73.24% | 538.15 | 73.66% | 19.90 | 3.70% |
| Control Environment Products (CE) | 46.20 | 17.40% | 52.84 | 21.08% | (6.65) | -12.58% | 135.29 | 17.76% | 161.40 | 22.09% | (26.11) | -16.18% |
| Water Solution Products (WATER) | 11.38 | 4.28% | 9.22 | 3.68% | 2.16 | 23.45% | 40.67 | 5.34% | 22.50 | 3.08% | 18.17 | 80.77% |
| Medical and Healthcare Products | 15.66 | 5.90% | 6.35 | 2.53% | 9.31 | 146.65% | 27.98 | 3.67% | 8.51 | 1.17% | 19.47 | 228.70% |
| Total revenue from sales and services | 265.50 | 100% | 250.64 | 100% | 14.86 | 5.93% | 761.99 | 100% | 730.57 | 100% | 31.43 | 4.30% |
In quarter 3/2024, the total revenue from sales and services provision were 265.50 MB, with 192.27 MB of Occupational Safety, Health and Environment Products or ‘SAFETY’ accounting for 72.42%, 46.20 MB of Control Environment Products or ‘CE’ accounting for 17.40%, 11.38 MB of Water Solution Products or ‘WATER’ accounting for 4.28%, and 15.66 MB of Medical and Healthcare Products accounting for 5.90%.
The revenue from sales and services provision in SAFETY products was reported at 192.27 MB, increased by 10.04 MB or 5.51% YoY. For the personal protective equipment, the Company has developed new product models, leading to higher sales both from existing and new customers in the industrial sector, as well as from the development of online and tele-sales channels, boosting sales from SMEs and individual customers. However, revenue decreased for products in the rubber gloves and nitrile gloves, in line with the decrease in market prices. Sales revenue of the technical and engineering product for safety workplace increased compare to the same quarter of previous year.
The revenue from sales and services provision in CE products was 46.20 MB, decreased 6.65 MB or 12.58% YoY. Major customers in the electronics industry have decreased production according to the slowdown in the electronics industry. However, the company has expanded its customer to the food and beverage industry and pharmaceutical industry, resulting in the increase in sales revenue from new customers.
The revenue from sales and services provision in the WATER products was 11.38 MB, increased by 2.16 MB or 23.45% YoY, mainly due to the number of construction projects and water treatment system installation services increased compared to the same period of the previous year, and more sales revenue from related products, machinery and equipment.
The revenue from sales provision in Medical and Healthcare Products was 15.66 MB increased by 9.31 MB or 146.65% YoY, mainly from new product marketing of adult diaper and healthcare products, with sales revenue increased from sales to government agencies and sales through online channels.
Cost of Sales and Services
The Company’s total costs in quarter 3/2024 were 202.58 MB, comprising of 194.77 MB cost of sales and 7.81 MB cost of rendering of services. Cost of sales and services increased 18.03 MB or 9.77% YoY, proportionally with higher revenue from sales and services. Costs of sales and services accounted for 76.30% of revenue from sales and services.
Resulted in the Company’s gross profit of 62.92 MB, representing gross profit margin of 23.70%, gross profit decreased by 3.17 MB or 4.80% YoY, mainly due to the lower gross profit in the rubber gloves and nitrile gloves in line with market prices. In addition, the proportion of sales to government sector increased, which did not have high gross profit margin, resulting in a decrease in the overall average gross profit margin, compared with gross profit of 66.09 MB, representing gross profit margin of 26.37% in the same quarter of previous year.
Distribution Costs and Administrative Expenses
In quarter 3/2024, Distribution costs and administrative expenses were 47.70 MB, consisting distribution costs of 25.10 MB and administrative expenses of 22.60 MB. Distribution costs and administrative expenses decreased by 1.16 MB or 2.37% YoY, the expenses were decrease, mainly from employee expenses. Meanwhile, marketing expenses, advertising and promotion expenses and transportation expenses were increase.
In quarter 3/2024, the company had the gain on exchange rate-net of 4.23 MB, while there was the loss on exchange rate-net of 0.41 MB in the same quarter of the previous year.
The company’s financial cost was 0.90 MB, increased by 0.34 MB or 60.36% compared to financial cost of 0.56 MB in the same quarter of previous year due to the increased in short-term loans from financial institutions.
Net Profit
In quarter 3/2024, the company’s consolidate net profit attributable to equity holders was 19.35 MB, accounted for net profit margin 7.26%, increasing by 4.73 MB or 32.31% compared to net profit attributable to equity holders of 14.62 MB, accounted for net profit margin 5.80% in the same quarter of previous year.
Financial Position
Unit : MB
| September 30, 2024 | December 31, 2023 | Increased (Decreased) |
% Change | |||
|---|---|---|---|---|---|---|
| Amount | % | Amount | % | |||
| Current Assets | 468.17 | 74.08% | 468.44 | 72.81% | (0.27) | -0.06% |
| Non-Current Assets | 163.84 | 25.92% | 174.95 | 27.19% | (11.11) | -6.35% |
| Total Assets | 632.01 | 100.00% | 643.39 | 100.00% | (11.38) | -1.77% |
| Current Liabilities | 214.85 | 34.00% | 234.39 | 36.44% | (19.55) | -8.34% |
| Non-Current Liabilities | 35.96 | 5.69% | 34.60 | 5.38% | 1.35 | 3.91% |
| Total Liabilities | 250.80 | 39.69% | 268.99 | 41.82% | (18.19) | -6.76% |
| Shareholder's Equity of the Company | 381.09 | 60.31% | 374.28 | 58.18% | 6.82 | 1.82% |
Assets
As of September 30, 2024, the Company’s total assets were 632.01 MB, decreased by 11.38 MB or 1.77% from December 31, 2023. Current assets decreased by 0.27 MB or 0.06% mainly from cash and cash equivalents decreased 15.42 MB and net-inventories decreased 2.03 MB. However, trade and other current receivables increased by 15.07 MB and short-term loan to joint venture partner increased 2 MB. Non-current assets decreased by 11.11 MB or 6.35%, mainly from investment in joint ventures decreased 7.88 MB, due to returned of investment in the joint venture. Property, plant and equipment-net decreased mainly from depreciation for the period of 5.48 MB, however, increase in the purchase of office equipment of 1.67 MB.
Liabilities
As of September 30, 2024, the Company’s total liabilities were 250.80 MB, decreased by 18.19 MB or 6.76% from December 31, 2023. The decrease in liabilities was mainly due to a decrease in current liabilities, which decreased mainly from trade and other current payables decreased 17.11 MB and current income tax payable decreased 4.85 MB. However, short-term loans from financial institutions increased 1.76 MB. Non-current liabilities increased mainly due to an increase in provisions for employee benefit liabilities of 2.27 MB.
Shareholder’s equity
As of September 30, 2024, Shareholders’ equity of the Company was 381.09 MB, increased 6.82 MB or 1.82% from December 31, 2023. Shareholders’ equity increased from 51.37 MB of net profit for the period, while shareholders’ equity decreased from dividend payment of 44.55 MB.
Cash Flows
Unit : MB
| Cash Flows | September 30, 2024 | September 30, 2023 |
|---|---|---|
| Cash flow from (used in) operating activities | 26.59 | 76.39 |
| Cash flow from (used in) investing activities | 4.98 | (1.58) |
| Cash flow from (used in) financing activities | (47.05) | (71.75) |
| Net increase (decrease) in cash and cash equivalents | (15.49) | 3.06 |
| Cash and cash equivalents at the end of the period | 46.27 | 56.54 |
For the nine month period, ending September 30, 2024, the Company’s net cash from the operating activities was 26.59 MB, with operating profits prior to changes in the operating assets and liabilities of 66.92 MB. Cash flow decreased from trade and other receivables increased 14.76 MB, inventories increased 2.42 MB, payment of trade and other current payables of 16.84 MB and payment of income tax of 6.91 MB. However, cash flow received from income tax refund of 0.61 MB.
Cash flow from investment activities was 4.98 MB mainly from the return of investment in a joint ventures of 8 MB and interest received of 0.41 MB. While, cash flow decreased from short-term loan to joint venture partner of 2 MB and purchase fix assets of 1.67 MB.
Cash flow used in financing activities was 47.05 MB to repayment of liabilities under lease agreement of 1.94 MB, interest expense of 2.32 MB and dividend payment of 44.55 MB. However, cash flow received from short-term loan from financial institutions of 1.76 MB.
Management Discussion & Analysis (MD&A) Quarter 2/2024
Overview
| Q2/2024 | Q2/2023 | Increased (Decreased) |
% YoY | 6M/2024 | 6M/2023 | Increased (Decreased) |
% YoY | |
|---|---|---|---|---|---|---|---|---|
| Revenue from sales | 231.87 | 235.30 | (3.43) | -1.46% | 481.50 | 470.50 | 11.00 | 2.34% |
| Revenue from rendering of services | 5.31 | 3.70 | 1.62 | 43.67% | 15.00 | 9.43 | 5.57 | 59.11% |
| Total revenues | 237.18 | 239.00 | (1.82) | -0.76% | 496.49 | 479.93 | 16.57 | 3.45% |
| Cost of sales | (173.05) | (172.54) | 0.51 | 0.29% | (354.27) | (343.59) | 10.68 | 3.11% |
| Cost of services | (3.79) | (2.39) | 1.40 | 58.43% | (11.92) | (6.99) | 4.94 | 70.66% |
| Total costs | (176.84) | (174.93) | 1.90 | 1.09% | (366.19) | (350.58) | 15.61 | 4.45% |
| Gross profit | 60.35 | 64.07 | (3.72) | -5.80% | 130.30 | 129.35 | 0.95 | 0.74% |
| Gross profit margin (%) | 25.44% | 26.81% | -1.36% | 26.24% | 26.95% | -0.71% | ||
| Other income | 0.49 | 3.49 | (3.00) | -85.85% | 1.50 | 3.83 | (2.33) | -60.78% |
| Total distribution costs and administrative expenses | (47.64) | (48.43) | (0.78) | -1.62% | (97.04) | (97.98) | (0.94) | -0.96% |
| Gain (Loss) on exchange rate | 0.43 | (1.50) | 1.93 | 128.46% | (1.53) | (1.15) | 0.39 | 33.89% |
| Profit before finance costs and income taxes | 13.63 | 17.62 | (4.00) | -22.68% | 33.23 | 34.06 | (0.82) | -2.42% |
| Profit before finance costs and income taxes (%) | 5.73% | 7.27% | -1.53% | 6.67% | 7.04% | -0.37% | ||
| Finance costs | (0.74) | (0.45) | 0.29 | 63.70% | (1.49) | (1.08) | 0.42 | 38.63% |
| Share of profit(Loss) form investment in joint ventures | (0.01) | 0.61 | (0.20) | 0.80 | ||||
| Income tax | 3.51 | (3.73) | 0.40 | (7.08) | ||||
| Profit attributable to equity holders | 16.40 | 14.06 | 2.34 | 16.65% | 31.95 | 26.71 | 5.24 | 19.62% |
| Net profit margin (%) | 6.90% | 5.80% | 1.10% | 6.42% | 5.52% | 0.89% | ||
| Basic earnings per share (Baht) | 0.08 | 0.07 | 0.012 | 16.65% | 0.16 | 0.13 | 0.026 | 19.62% |
Referring to the operating performance in the consolidated financial statement for the second quarter, ending June 30, 2024, Phol Dhanya PCL (the Company)’s total revenue from sales and services were 237.18 MB, similar to the revenue from sales and services of 239 MB in the same quarter of the previous year, which decreased by 1.82 MB or 0.76% YoY. Revenue from Occupational Safety, Health and Environment Products or ‘SAFETY’ was similar to the same quarter of the previous year and revenue from Water Solution Products or WATER was increase due to the construction projects, water treatment system installation services and revenue from selling related products and equipment. In addition, revenue from Healthcare Products increase from expanding into new product markets. However, revenue from Control Environment Products or ‘CE’ decreased due to the slowdown in the industry of main customers in electronic segment. In quarter 2/2024, the company’s gross profit was 60.35 MB, representing gross profit margin of 25.44%, gross profit decreased by 3.72 MB or 5.80% YoY in line with lower sales revenue and lower gross profit in the rubber glove and nitrile glove in line with market prices. Distribution costs and administrative expenses were similar, compared to the same quarter of the previous year.
In quarter 2/2024, the Company has restructured of the shareholding structure in the subsidiaries to enhance the managerial efficiency within the group, by divesting the investment capital in a subsidiary; Phol Water, to another subsidiary; Phol Palladium. Such divestment does not have any impact on the operating results as shown in the consolidated statement of financial position, though a loss was incurred from the divestment following a corporate income tax calculation, resulting in no income tax for the current period, and hence an income tax expense reversal of 3.51 MB was booked. As the result, the Company’s net profit for the quarter 2/2024 was 16.40 MB, representing net profit margin of 6.90%, increased by 2.34 MB or 16.65% YoY compared to the net profit of 14.06 MB, representing net profit margin of 5.80% in the same quarter of previous year.
For the six months period, ending June 30, 2024, the Company’s total revenue from sales and services were 496.49 MB, increased by 16.57 MB or 3.45% YoY compared to the revenue from sales and services of 479.93 MB in the same period of previous year. The Company’s consolidated net profit attributable to equity holders of 31.95 MB, representing a net profit margin of 6.42%, increased by 5.24 MB or 19.62% YoY compared to the net profit of 26.71 MB, representing net profit margin of 5.52% in the same period of previous year.
Revenue from Sales and Services
Unit : MB
| Q2/2024 | % | Q2/2023 | % YoY | Increased (Decreased) |
% | 6M/2024 | % | 6M/2023 | % | Increased (Decreased) |
% YoY | |
|---|---|---|---|---|---|---|---|---|---|---|---|---|
| Occupational Safety, Health and Environment Products (SAFETY) | 179.44 | 75.65% | 178.55 | 74.71% | 0.89 | 0.50% | 369.24 | 74.37% | 360.41 | 75.10% | 8.84 | 2.45% |
| Control Environment Products (CE) | 41.35 | 17.44% | 51.56 | 21.58% | (10.21) | -19.80% | 85.63 | 17.25% | 104.07 | 21.68% | (18.44) | -17.72% |
| Water Solution Products (WATER) | 9.61 | 4.05% | 7.69 | 3.22% | 1.92 | 25.00% | 29.29 | 5.90% | 13.28 | 2.77% | 16.01 | 120.56% |
| Medical and Healthcare Products | 6.78 | 2.86% | 1.20 | 0.50% | 5.58 | 466.91% | 12.33 | 2.48% | 2.17 | 0.45% | 10.16 | 469.22% |
| Total revenue from sales and services | 237.18 | 100% | 239.00 | 100% | (1.82) | -0.76% | 496.49 | 100% | 479.93 | 100% | 16.57 | 3.45% |
In quarter 2/2024, the total revenue from sales and services provision were 237.18 MB, with 179.44 MB of Occupational Safety, Health and Environment Products or SAFETY accounting for 75.65%, 41.35 MB of Control Environment Products or CE accounting for 17.44%, 9.61 MB of Water Solution Products or WATER accounting for 4.05%, and 6.78 MB of Medical and Healthcare Products accounting for 2.86%.
The revenue from sales and services provision in SAFETY products was reported at 179.44 MB, which is about the same as in the same quarter of previous year, increasing by 0.89 MB or 0.50%. For the personal protective equipment, the Company has developed new product models, leading to higher sales both from existing and new customers in the industrial sector, as well as from the development of online and tele-sales channels, boosting sales from SMEs and individual customers. However, revenue decreased for products in the rubber gloves and nitrile gloves, in line with the decrease in market prices. Sales revenue of the technical and engineering product for safety workplace increased compare to the same quarter of previous year.
The revenue from sales and services provision in CE products was 41.35 MB, decreased 10.21 MB or 19.80% compared to the same quarter of previous year. Major customers in the electronics industry have decreased production according to the slowdown in the electronics industry.
The revenue from sales and services provision in the WATER products was 9.61 MB, increased 1.92 MB or 25% compared to the same quarter of previous year, mainly due to the number of construction projects and water treatment system installation services increased compared to the same period of the previous year, and sale of related products, machinery and equipment increased.
And revenue from sales provision in Medical and Healthcare Products was 6.78 MB increased by 5.58 MB or 466.91% compared to the same quarter of previous year, mainly from the sales of adult diaper and healthcare products.
Cost of Sales and Services
The Company’s total costs in quarter 2/2024 were 176.84 MB, comprising of 173.05 MB cost of sales and 3.79 MB cost of rendering of services, costs of sales and services accounted for 74.56% of revenue from sales and services.
Resulted in the Company’s gross profit of 60.35 MB, representing gross profit margin of 25.44%, gross profit decreased by 3.72 MB or 5.80% in line with lower sales revenue and lower gross profit in the rubber gloves and nitrile gloves, in line with market prices, compared with gross profit of 64.07 MB, representing gross profit margin of 26.81% in the same quarter of previous year.
Distribution Costs and Administrative Expenses
In quarter 2/2024, Distribution costs and administrative expenses were 47.64 MB, consisting distribution costs of 25.52 MB and administrative expenses of 22.13 MB. Distribution costs and administrative expenses were similar compared to the same quarter of the last year, the expenses were increase, mainly from marketing expenses, advertising and promotion expenses and transportation expenses. Meanwhile, employee expenses and other administrative expenses were decrease.
In quarter 2/2024, the company had the gain on exchange rate of 0.43 MB, while there was the loss on exchange rate of 1.50 MB in the same quarter of the previous year.
The company’s financial cost was 0.74 MB, increased by 0.29 MB or 63.70% compared to financial cost of 0.45 MB in the same quarter of previous year due to the increased in short-term loans from financial institutions.
Net Profit
Given the restructuring of the shareholding structure in the subsidiaries by way of investment capital divestment of Phol Water to Phol Palladium, the loss from corporate income tax calculation was incurred, resulting in no income tax for the current period. Hence, the income tax expense reversal of 3.51 million Baht was subsequently booked. As the result, the Company’s net profit for the quarter 2/2024 was 16.40 MB, representing net profit margin of 6.90%, increased by 2.34 MB or 16.65% YoY compared to the net profit of 14.06 MB, representing net profit margin of 5.80% in the same quarter of previous year.
Financial Position
Unit : MB
| June 30, 2024 | December 31, 2023 | Increased (Decreased) |
% Change | |||
|---|---|---|---|---|---|---|
| Amount | % | Amount | % | |||
| Current Assets | 489.30 | 74.80% | 468.44 | 72.81% | 20.86 | 4.45% |
| Non-Current Assets | 164.87 | 25.20% | 174.95 | 27.19% | (10.08) | -5.76% |
| Total Assets | 654.17 | 100.00% | 643.39 | 100.00% | 10.78 | 1.68% |
| Current Liabilities | 236.47 | 36.16% | 234.39 | 36.44% | 2.08 | 0.89% |
| Non-Current Liabilities | 35.75 | 5.47% | 34.60 | 5.38% | 1.15 | 3.33% |
| Total Liabilities | 272.23 | 41.62% | 268.99 | 41.82% | 3.23 | 1.20% |
| Shareholder's Equity of the Company | 381.83 | 58.38% | 374.28 | 58.18% | 7.55 | 2.02% |
Assets
As of June 30, 2024, the Company’s total assets were 654.17 MB, increased by 10.78 MB or 1.68% from December 31, 2023. The assets increased from current assets, which increased by 20.86 MB or 4.45% mainly from net-inventories increased 14.65 MB and other current receivables-net increased mainly from advance payment for inventories of 3.56 MB. However, cash and cash equivalents decreased 2.30 MB
Non-current assets decreased 10.08 MB or 5.76%, mainly from return of investment in joint ventures 7.94 MB and property, plant and equipment-net decreased mainly from depreciation for the period of 3.66 MB, however, increase in the purchase of office equipment of 0.93 MB.
Liabilities
As of June 30, 2024, the Company’s total liabilities were 272.23 MB, increased by 3.23 MB or 1.20% from December 31, 2023. The current liabilities increased mainly from short-term loans from financial institutions of 6.10 MB and trade payables increased 10.24 MB. However, other current payables decreased by 9.02 MB and current income tax payable decreased by 5.86 MB.
Shareholder’s equity
As of June 30, 2024, Shareholders’ equity of the Company was 381.83 MB, increased 7.55 MB or 2.02% from December 31, 2023. Shareholders’ equity increased from 31.95 MB of net profit for the period, while shareholders’ equity decreased from dividend payment of 24.30 MB.
Cash Flows
Unit : MB
| Cash Flows | June 30, 2024 | June 30, 2023 |
|---|---|---|
| Cash flow from (used in) operating activities | 13.54 | 67.23 |
| Cash flow from (used in) investing activities | 5.17 | (3.65) |
| Cash flow from (used in) financing activities | (20.91) | (71.85) |
| Net increase (decrease) in cash and cash equivalents | (2.20) | (8.27) |
| Cash and cash equivalents at the end of the period | 59.38 | 45.25 |
For the six month period, ending June 30, 2024, the Company’s net cash from the operating activities was 13.54 MB, with operating profits prior to changes in the operating assets and liabilities of 42.59 MB. Cash flow decreased from inventories increased 16.10 MB, trade and other receivables increased 6.31 MB, payment of trade and other current payables of 0.69 MB and payment of income tax of 6.56 MB. However, cash flow received from income tax refund of 0.61 MB.
Cash flow from investment activities was 5.17 MB mainly from the return of investment in a joint ventures of 8 MB and interest received of 0.24 MB. While, cash flow decreased from short-term loan to joint venture partner of 2 MB and purchase fix assets of 0.98 MB.
Cash flow used in financing activities was 20.91 MB to repayment of liabilities under lease agreement of 1.28 MB, interest expense of 1.44 MB and dividend payment of 24.30 MB. However, cash flow received from short-term loan from financial institutions of 6.10 MB.
Management Discussion & Analysis (MD&A) Quarter 1/2024
Overview
Referring to the operating performance in the consolidated financial statement for the first quarter, ending March 31, 2024, Phol Dhanya PCL (the Company)’s total revenue from sales and services were 259.31 MB, increased by 18.38 MB or 7.63% YoY compared with revenue from sales and services of 240.93 MB, mainly from Occupational Safety, Health and Environment Products or ‘SAFETY’ increased from sales in the personal protective equipment and revenue from Water Solution Products or WATER were increase due to the number of construction projects, water treatment system installation services and revenue from selling products, machinery and equipment increased compared to the same period of the previous year. In addition, the Company had revenue from Healthcare Products increase from expanding into new product markets. However, revenue from Control Environment Products or ‘CE’ decreased due to the slowdown in the industry of main customers in electronic.
The gross profit increased in line with higher revenue from sales and services, for the first quarter of 2024, the company’s gross profit was 69.96 MB, representing gross profit margin of 26.98%, gross profit increased compared with gross profit of 65.28 MB, representing gross profit margin of 27.10% in the same quarter of previous year. Distribution costs and administrative expenses similar, compared to the same quarter of the previous year. The Company’s net profit for the first quarter of 2024 was 15.55 MB; equivalent to 5.97%, decreased 2.90 MB or 22.91% YoY at 12.65 MB; equivalent to 5.24%.
Operating performance
Unit : MB
| Q1/2024 | Q1/2023 | Increased (Decreased) |
% YoY | |
|---|---|---|---|---|
| Revenue from sales | 249.63 | 235.20 | 14.43 | 6.13% |
| Revenue from rendering of services | 9.68 | 5.73 | 3.96 | 69.08% |
| Total Revenues | 259.31 | 240.93 | 18.38 | 7.63% |
| Cost of sales | (181.22) | (171.05) | 10.17 | 5.95% |
| Cost of services | (8.14) | (4.60) | 3.54 | 77.01% |
| Total Costs | (189.36) | (175.65) | 13.71 | 7.81% |
| Gross Profit | 69.96 | 65.28 | 4.67 | 7.16% |
| Gross Profit Margin (%) | 26.98% | 27.10% | -0.12% | |
| Other income | 1.01 | 0.34 | 0.67 | 198.81% |
| Total distribution costs and administrative expenses | (49.40) | (49.55) | (0.15) | -0.31% |
| Gain (Loss) on exchange rate | (1.96) | 0.36 | (2.32) | -646.24% |
| Profit before finance costs and income taxes | 19.61 | 16.43 | 3.17 | 19.31% |
| Profit before finance costs and income taxes (%) | 7.53% | 6.81% | 0.72% | |
| Finance costs | (0.76) | (0.63) | 0.13 | 20.70% |
| Share of profit(Loss) form investment in joint ventures | (0.19) | 0.19 | (0.00) | -2.06% |
| Income tax expenses | (3.11) | (3.35) | (0.24) | -7.11% |
| Profit attributable to equity holders | 15.55 | 12.65 | 2.90 | 22.91% |
| Net profit margin (%) | 5.97% | 5.24% | 0.73% | |
| Basic earnings per share (Baht) | 0.08 | 0.06 | 0.014 | 22.91% |
Revenue
Unit : MB
| Q1/2024 | % | Q1/2023 | % | Increased (Decreased) |
% | |
|---|---|---|---|---|---|---|
| Occupational Safety, Health and Environment Products (SAFETY) | 188.20 | 72.58% | 179.11 | 74.34% | 9.09 | 5.08% |
| Control Environment Products (CE) | 46.61 | 17.97% | 55.30 | 22.95% | (8.69) | -15.71% |
| Medical and Healthcare Products | 4.82 | 1.86% | 0.93 | 0.39% | 3.89 | 418.28% |
| Water Solution Products (WATER) | 19.68 | 7.59% | 5.59 | 2.32% | 14.09 | 252.06% |
| Total revenue from sales and services | 259.31 | 100% | 240.93 | 100.00% | 18.38 | 7.63% |
In quarter 1/2024, the total revenue from sales and services provision were 259.31 MB, with 188.20 MB of Occupational Safety, Health and Environment Products or SAFETY accounting for 72.58%, 46.61 MB of Control Environment Products or CE accounting for 17.97%, 4.82 MB of Medical and Healthcare Products accounting for 1.86%, and 19.68 MB of Water Solution Products or WATER accounting for 7.59%.
The revenue from sales and services provision in SAFETY products was 188.20 MB, increased 9.09 MB or 5.08% compared to the same quarter of previous year, mainly from revenue from sales of personal protective equipment increased in accordance with the expansion of the industrial sector and services sector. In addition, the Company has developed new product items, resulting in increased sales for both existing and new customers.
The revenue from sales and services provision in CE products was 46.61 MB, decreased 8.69 MB or 15.71% compared to the same quarter of previous year. Major customers in the electronics industry have decreased production according to the slowdown in the electronics industry.
For the Medical and Healthcare Products, which is begin to expand market. In quarter 1/2024, revenue from sales provision in Medical and Healthcare Products was 4.82 MB increased 3.89 MB or 418.28% compared to the same quarter of previous year, mainly from the sales of adult diaper and healthcare products.
The revenue from sales and services provision in the WATER products was 19.68 MB, increased 14.09 MB or 252.06% compared to the same quarter of previous year, mainly due to the number of construction projects and water treatment system installation services increased compared to the same period of the previous year. In addition, revenue increased from selling products, machinery and equipment for construction projects of joint ventures.
Cost of Sales and Services
The Company’s total costs in quarter 1/2024 were 189.36 MB, comprising of 181.22 MB cost of sales and 8.14 MB cost of rendering of services. Cost of sales and services increased 13.71 MB or 7.81% proportionally with higher revenue from sales and services. In quarter 1/2024, costs of sales and services accounted for 73.02% of revenue from sales and services.
The Company’s gross profit was 69.96 MB, representing gross profit margin of 26.98%, gross profit increased 4.67 MB or 7.16% compared with gross profit of 65.28 MB, representing gross profit margin of 27.10% in the same quarter of previous year.
Distribution Costs and Administrative Expenses
In quarter 1/2024, Distribution costs and administrative expenses were 49.40 MB, consisting distribution costs of 24.67 MB and administrative expenses of 24.73 MB. Distribution costs and administrative expenses were similar compared to the same quarter of the last year, the expenses were increase, mainly from marketing expenses, advertising and promotion expenses and transportation expenses. Meanwhile, employee expenses and other administrative expenses were decrease.
In quarter 1/2024, the company had the loss on exchange rate of 1.96 MB, while there was the gain on exchange rate of 0.36 MB in the same quarter of the previous year.
The company’s financial cost was 0.76 MB, increasing by 0.13 MB or 20.70% according an increase interest rates compared to financial cost of 0.63 MB in the same quarter of previous year.
Net Profit
In quarter 1/2024, the company’s consolidate net profit attributable to equity holders was 15.55 MB, accounted for net profit margin 5.97%, increasing by 2.90 MB or 22.91% compared to net profit attributable to equity holders of 12.65 MB, accounted for net profit margin 5.24% in the same quarter of previous year.
Financial Position
Unit : MB
| March 31, 2024 | December 31, 2023 | Increased (Decreased) |
% Change | |||
|---|---|---|---|---|---|---|
| Amount | % | Amount | % | |||
| Current Assets | 471.28 | 73.02% | 468.44 | 72.81% | 2.84 | 0.61% |
| Non-Current Assets | 174.10 | 26.98% | 174.95 | 27.19% | (0.85) | -0.49% |
| Total Assets | 645.37 | 100.00% | 643.39 | 100.00% | 1.98 | 0.31% |
| Current Liabilities | 219.96 | 34.09% | 234.39 | 36.44% | (14.43) | -6.16% |
| Non-Current Liabilities | 35.55 | 5.51% | 34.60 | 5.38% | 0.95 | 2.74% |
| Total Liabilities | 255.51 | 39.60% | 268.99 | 41.82% | (13.48) | -5.01% |
| Shareholder's Equity of the Company | 389.74 | 60.40% | 374.28 | 58.18% | 15.47 | 4.13% |
Assets
As of March 31, 2024, the Company’s total assets were 645.37 MB, increased 1.98 MB or 0.31% from December 31, 2023. The assets increased from current assets, which increased 2.84 MB or 0.61% mainly from trade and other current receivables-net increased 20.47 MB. However, cash and cash equivalents decreased 11.06 MB and net-inventories decreased 6.06 MB. Non-current assets decreased 0.85 MB or 0.49%, mainly from investment in joint venture decreased 0.74 MB, property, plant and equipment-net decreased 1.02 MB, while, right of use asset-net increased 0.94 MB.
Liabilities
As of March 31, 2024, the Company’s total liabilities were 255.51 MB, decreased 13.48 MB or 5.01% from December 31, 2023. The liabilities decreased mainly from the decrease of 10.82 MB of short-term loans from financial institutions and trade and other payables decreased 7.81 MB. However, lease liabilities increased 0.81 MB and current income tax payable increased 3.32 MB.
Shareholder’s equity
As of March 31, 2024, Shareholders’ equity of the Company was 389.74 MB, increased 15.47 MB or 4.13% from December 31, 2023 from 15.47 MB of net profit for the period.
Cash Flows
Unit : MB
| Cash Flows | March 31, 2024 | March 31, 2023 |
|---|---|---|
| Cash flow from (used in) operating activities | 1.54 | 31.55 |
| Cash flow from (used in) investing activities | -0.36 | -2.1 |
| Cash flow from (used in) financing activities | -12.16 | -48.03 |
| Net increase (decrease) in cash and cash equivalents | -10.98 | -18.59 |
| Cash and cash equivalents at the end of the period | 50.62 | 34.99 |
For the three month period, ending March 31, 2024, the Company’s net cash from the operating activities was 1.54 MB, with operating profits prior to changes in the operating assets and liabilities of 26 MB. Cash flow increased from inventories decreased 5.87 MB. While, cash flow decreased from trade and other receivables increased 20.25 MB and net- trade and other payables decreased 10.40 MB.
Cash flow used in investment activities was 0.36 MB to purchase fix assets of 0.79 MB while, cash flow acquired 0.40 MB from interest received.
Cash flow used in financing activities was 12.16 MB to repayment of short-term loan from financial institutions of 10.82 MB, repayment of liabilities under lease agreement of 0.61 MB and interest expense of 0.73 MB.
Management Discussion & Analysis (MD&A) Yearly 2023
Overview
Referring to the operating performance in the consolidated financial statement for the year, ending December 31, 2023, Phol Dhanya PCL (the Company)’s total revenue from sales and services were 971.43 MB, decreasing by 29.05 MB or 2.90% compared to the last year with revenue from sales and services of 1,000.48 MB, mainly from revenue from Occupational Safety, Health and Environment Products or ‘SAFETY’ and Control Environment Product or ‘CE’ were decrease mainly due to a significant drop in market prices and demand of rubber gloves, nitrile gloves and disease related products. However, SAFETY and CE products used in the industrial sector are still securing a continuous increase in purchase orders in pursuit of the expansion of the manufacturing sector in key industries, and the revenue increased from new customers and new products marketing in healthcare products. In addition, revenue from Water Solution Products or WATER were increase from selling products, machinery and equipment for construction projects and revenue from water treatment system installation services and maintenance services increased compared to the same period of the previous year. The gross profit increased compare to the previous year due to the proportion of sales of products with high gross profit margins increased and adding new products and increases of selling price in some product categories, as the result, the company’s gross profit was 258.67 MB, representing gross profit margin of 26.63%. Distribution costs and administrative expenses were increase mainly from advertising and promotion expenses and employee expenses. Other income increased mainly from receiving refunds on fines and fees from water treatment projects.
Summary of operating results for the 2023, the Company’s net profit attributable to equity holders of was 58.30 MB, representing a net profit margin of 5.93%, increasing by 4.26 MB or 7.89%, compared to the previous year with 54.04 MB of net profit attributable to equity holders, representing a net profit margin of 5.39%.
Operating performance
Unit : MB
| Y2023 | Y2022 | Increased (Decreased) |
% YoY | |
|---|---|---|---|---|
| Revenue from sales | 950.14 | 984.36 | (34.21) | -3.48% |
| Revenue from rendering of services | 21.28 | 16.12 | 5.16 | 31.99% |
| Total Revenues | 971.43 | 1,000.48 | (29.05) | -2.90% |
| Cost of sales | (698.00) | (732.12) | (34.12) | -4.66% |
| Cost of services | (14.76) | (10.63) | 4.14 | 38.92% |
| Total Costs | (712.76) | (742.74) | (29.98) | -4.04% |
| Gross Profit | 258.67 | 257.74 | 0.93 | 0.36% |
| Gross Profit Margin (%) | 26.63% | 25.76% | ||
| Other income | 11.51 | 2.86 | 8.65 | 302.79% |
| Total Distribution costs and administrative expenses | (194.63) | (187.69) | 6.95 | 3.70% |
| Profit before finance costs and income taxes | 75.54 | 72.91 | 2.63 | 3.61% |
| Profit before finance costs and income taxes (%) | 7.70% | 7.27% | ||
| Loss from impairment of financial assets | (9.31) | - | 9.31 | |
| Financial Costs | (2.40) | (2.82) | (0.42) | -14.79% |
| Reversal of allowance for credit loss (credit loss) on financial asset-nets | 9.14 | (1.17) | 7.97 | 683.57% |
| Share of profit(Loss) form investment in joint ventures | 0.92 | (0.27) | 0.66 | |
| Income tax expenses | (14.17) | (14.62) | (0.45) | -3.06% |
| Profit attributable to equity holders | 58.30 | 54.04 | 4.26 | 7.89% |
| Net profit margin (%) | 5.94% | 5.39% | ||
| Basic earnings per share (Baht) | 0.29 | 0.27 | 0.02 | 7.89% |
Revenue
Unit : MB
| Y2023 | % | Y2022 | % | Increased (Decreased) |
% | |
|---|---|---|---|---|---|---|
| Occupational Safety, Health and Environment Products (SAFETY) | 722.85 | 74.41% | 746.81 | 74.65% | (23.97) | -3.21% |
| Control Environment Products (CE) | 216.33 | 22.27% | 222.69 | 22.26% | (6.37) | -2.86% |
| Water Solution Products (WATER) | 32.25 | 3.32% | 30.97 | 3.10% | 1.28 | 4.13% |
| Total revenue from sales and services | 971.43 | 100% | 1,000.48 | 100% | (29.05) | -2.90% |
In 2023, the total revenue from sales and services provision were 971.43 MB, with 722.85 MB of Occupational Safety, Health and Environment Products or ‘SAFETY’, accounting for 74.41%, 216.33 MB of Control Environment Products or ‘CE’, accounting for 22.27% and 32.25 MB of Water Solution Products or ‘WATER’, accounting for 3.32%.
The revenue from sales and services provision in SAFETY products was 722.85 MB, decreasing by 23.97 MB or 3.21% compared to the previous year, mainly due to a decrease in market prices and demand of rubber gloves, nitrile gloves and disease related products. However, SAFETY products in other categories increased in purchase orders from industrial customers in accordance with the expansion of the industrial sector and more revenue from technical and engineering safety and environment products. In addition, revenue from new customers increased from new products marketing in related to the chemical storage of hazardous chemicals and healthcare products.
The revenue from sales and services provision in CE products was 216.33 MB, decreasing by 6.37 MB or 2.86% compared to the previous year due to the main customers in the electronics industry reducing their order quantities according production decreased. In addition, revenue decreased from the decrease in market prices and demand of rubber gloves and nitrile gloves. However, revenue from CE products increased sales from adding item products to existing customers and new products marketing in the medical industry.
The revenue from sales and services provision in the WATER products was 32.25 MB, increasing by 1.28 MB or 4.13% compared to the previous year, mainly due to the revenue from water treatment system installation services and maintenance services increased compared to the the previous year0 In addition, revenue increased from selling products, machinery and equipment for construction projects of joint ventures.
Other Income
In 2023, the Company had other income of 11.51 MB, increasing by 8.65 MB compared with other income of 2.86 MB in the previous year. Other income increased mainly from debt repayment and refunds fines and fees from water treatment system projects that end of the lawsuit amount of 4.91 MB and gain on exchange rate of 1.50 MB and other income of 5.10 MB.
Cost of Sales and Services
The Company’s total costs in the year 2023 were 712.76 MB, comprising of 698 MB cost of sales and 14.76 MB cost of rendering of services. Cost of sales decreased proportionally with lower revenue from sales and cost of services increased proportionally with higher revenue from services. Costs of sales and services accounted for 73.37% of revenue from sales and services. The Company’s gross profit was 258.67 MB, representing gross profit margin of 26.63%.
Distribution Costs and Administrative Expenses
In 2023, distribution costs and administrative expenses were 194.63 MB, consisting distribution costs of 102.23 MB and administrative expenses of 92.40 MB. Distribution costs were increase mainly from salespersons’ travelling, advertising and promotion expenses in line with increased sales and marketing activities. Administrative expenses increased mainly from employee welfare and training, meanwhile, doubtful accounts and other administrative expenses decreased.
The company’s financial cost was 2.40 MB, decreasing by 0.42 MB or 14.79% compared to financial cost of 2.82 MB in the previous year.
Other Transactions
In 2023, the Company recorded loss arising from bad debt of financial assets of 9.31 MB, reversal of allowance for credit loss on financial assets-net of 9.14 MB and share of profit form investment in joint ventures of 0.92 MB.
Net Profit
In 2023, the company’s consolidate net profit attributable to equity holders was 58.30 MB, accounted for net profit margin 5.93%. Net profit increasing by 4.26 MB or 7.89% compared to net profit attributable to equity holders of 54.04 MB, accounted for net profit margin 5.39% in the previous year.
Financial Position
Unit : MB
| December 31, 2023 | December 31, 2022 | Increased (Decreased) |
% Change | |||
|---|---|---|---|---|---|---|
| Amount | % | Amount | % | |||
| Current Assets | 468.44 | 72.81% | 455.95 | 71.37% | 12.49 | 2.74% |
| Non-Current Assets | 174.95 | 27.19% | 182.87 | 28.63% | (7.92) | -4.33% |
| Total Assets | 643.39 | 100.00% | 638.82 | 100.00% | 4.57 | 0.72% |
| Current Liabilities | 234.39 | 36.44% | 241.89 | 37.79% | (7.50) | -3.10% |
| Non-Current Liabilities | 34.60 | 5.38% | 43.36 | 6.77% | (8.76) | -20.20% |
| Total Liabilities | 268.99 | 41.82% | 285.25 | 44.56% | (16.26) | -5.70% |
| Shareholder's Equity of the Company | 374.28 | 58.18% | 354.87 | 55.44% | 19.41 | 5.47% |
Assets
As of December 31, 2023, the Company’s total assets were 643.39 MB, increasing by 4.57 MB or 0.72% from December 31, 2022. The assets increased from current assets, increasing by 12.49 MB or 2.74%, mainly from cash and cash equivalents increased by 8.13 MB, trade and other current receivables-net increased by 10.28 MB. However, short-term loans to relate parties decreased by 2.94 MB and net-inventories decreased by 3.06 MB. Non-current assets decreased by 7.92 MB or 4.33%, mainly from investment in joint venture decreased by 1.33 MB, property, plant and equipment-net decreased by 2.43 MB and deferred tax assets - net decreased by 2.65 MB.
Liabilities
As of December 31, 2023, the Company’s total liabilities were 268.99 MB, decreasing by 16.26 MB or 5.70% from December 31, 2022. Current liabilities decreased mainly from short-term loans from financial institutions decreased 13.27 MB while, trade payable increased by 6.03 MB.
Non-current liabilities decreased mainly from non-current provisions for employee benefit of 7.34 MB and lease liabilities decreased 1.42 MB.
Shareholder’s equity
As of December 31, 2023, Shareholders’ equity of the Company was 374.28 MB, increasing by 19.41 MB or 5.47% from December 31, 2022. Shareholders’ equity increased from 58.30 MB of net profit for the period and 3.64 MB of other comprehensive income, while shareholders’ equity decreased mainly from dividend payment of 42.53 MB.
Cash Flows
Unit : MB
| Cash Flows | December 31, 2023 | December 31, 2022 |
|---|---|---|
| Cash flow from (used in) operating activities | 68.08 | 27.42 |
| Cash flow from (used in) investing activities | 0.71 | (16.04) |
| Cash flow from (used in) financing activities | (60.68) | (16.50) |
| Net increase (decrease) in cash and cash equivalents | 8.12 | (5.12) |
| Cash and cash equivalents at the end of the period | 61.68 | 53.55 |
For the year, ending December 31, 2023, the Company’s net cash from the operating activities was 68.08 MB, with operating profits prior to changes in the operating assets and liabilities of 88.98 MB. Cash flow increased from trade and other payables increased by 6.98 MB and inventories-net decreased by 1.20 MB. While, cash flow decreased from trade and other current receivables increased by 10.54 MB, payment for employee benefit of 6.29 MB, payment for income tax 13.25 MB, however, cash received from income tax return of 0.98 MB.
Cash flow from investment activities was 0.71 MB from received short-term loan to related parties of 4.44 MB, return of capital of investment in joint venture of 2 MB and interest received of 0.78 MB. However, cash used to payment short-term loan to related parties of 1.50 MB, to install solar rooftop and utility improvement of 3.32 MB, office building improvement and purchase equipment of 1.59 MB and purchase computer software of 0.45 MB.
Cash flow used in financing activities was 60.68 MB to repayment of short-term loan from financial institutions of 13.27 MB, repayment of long-term loans from financial institutions of 0.62 MB, repayment of liabilities under lease agreement of 2 MB, interest expense of 2.23 MB and dividend payment of 42.57 MB.
Management Discussion & Analysis (MD&A) Quarter 3/2023
Overview
Referring to the operating performance in the consolidated financial statement in the third quarter, ending September 30, 2023, Phol Dhanya PCL (the Company)’s total revenue from sales and services were 250.64 MB, decreasing by 2.45 MB or 0.97% compared to the same quarter of the last year with revenue from sales and services of 253.09 MB, mainly from revenue from Occupational Safety, Health and Environment Products or ‘SAFETY’ and Control Environment Product or ‘CE’ were decrease mainly due to a significant drop in market prices and demand of rubber gloves, nitrile gloves and disease related products. However, SAFETY and CE products used in the industrial sector are still securing a continuous increase in purchase orders in pursuit of the expansion of the manufacturing sector in key industries, and the revenue increased from new customers and new products marketing in healthcare products. In addition, revenue from Water Solution Products or WATER were increase from water treatment system installation services and maintenance services increased compared to the same period of the previous year. In quarter 3/2023, the Company’s gross profit was 66.09 MB, representing gross profit margin of 26.37%. And distribution costs and administrative expenses were decreases.
Summary of operating results for the quarter 3/2023, the Company’s net profit attributable to equity holders of was 14.62 MB, representing a net profit margin of 5.80%, increasing by 0.11 MB or 0.76%, similar compared to the same quarter of previous year with 14.51 MB of net profit attributable to equity holders, representing a net profit margin of 5.70%.
For the nine months period, ending September 30, 2023, the Company’s total revenue from sales and services were 730.57 MB, decreasing by 39.81 MB or 5.17% compared to the same period of previous year with revenue from sales and services of 770.38 MB. And the Company’s consolidate net profit attributable to equity holders of 41.33 MB, representing a net profit margin of 5.62%.
Operating performance
Unit : MB
| Q3/2023 | Q3/2022 | Increased (Decreased) |
% YoY | |
|---|---|---|---|---|
| Revenue from sales | 243.06 | 249.95 | (6.89) | -2.75% |
| Revenue from rendering of services | 7.57 | 3.14 | 4.44 | 141.29% |
| Revenue of water treatment system installation | - | - | - | |
| Total Revenues | 250.64 | 253.09 | (2.45) | -0.97% |
| Cost of sales | (178.85) | (183.43) | (4.59) | -2.50% |
| Cost of services | (5.71) | (1.69) | 4.02 | 237.95% |
| Cost of water treatment system installation | - | - | - | |
| Total Costs | (184.55) | (185.12) | (0.57) | -0.31% |
| Gross Profit | 66.09 | 67.97 | (1.88) | -2.77% |
| Gross Profit Margin (%) | 26.37% | 26.86% | ||
| Other income | 1.46 | 1.41 | 0.05 | 3.26% |
| Total Distribution costs and Administrative expenses | (48.54) | (50.14) | (1.59) | -3.17% |
| Profit before finance costs and income taxes | 19.00 | 19.25 | (0.25) | -1.28% |
| Profit before finance costs and income taxes (%) | 7.54% | 7.56% | ||
| Finance Costs | (0.62) | - | 0.62 | |
| Loss from impairment of trade and other receivables | (0.56) | (0.70) | (0.14) | -20.34% |
| Reversal of allowance for credit loss (credit loss) on trade and other receivables-nets | (0.10) | (0.17) | (0.07) | -40.96% |
| Share of profit form investment in joint ventures | 0.20 | - | 0.20 | |
| Income tax expenses | (3.29) | (3.87) | (0.57) | -14.83% |
| Profit attributable to equity holders | 14.62 | 14.51 | 0.11 | 0.76% |
| Net profit margin (%) | 5.80% | 5.70% | ||
| Basic earnings per share (Baht) | 0.07 | 0.07 | 0.001 | 0.76% |
Revenue
Unit : MB
| Q3/2023 | % | Q3/2022 | % | Increased | % | |
|---|---|---|---|---|---|---|
| Occupational Safety, Health and Environment Products (SAFETY) | 187.33 | 74.74% | 191.86 | 75.81% | (4.53) | -2.36% |
| Control Environment Products (CE) | 54.09 | 21.58% | 57.41 | 22.68% | (3.27) | -5.69% |
| Water Solution Products (WATER) | 9.22 | 3.68% | 3.82 | 1.51% | 4.99 | 130.59% |
| Total revenue from sales and services | 250.64 | 100% | 253.09 | 100.00% | (1.76) | -0.69% |
The total revenue from sales and services provision in the quarter 3/2023 were 250.64 MB, with 187.33 MB of Occupational Safety, Health and Environment Products or ‘SAFETY’, accounting for 74.74%, 54.09 MB of Control Environment Products or ‘CE’, accounting for 21.58% and 9.22 MB of Water Solution Products or ‘WATER’, accounting for 3.68%.
The revenue from sales and services provision in SAFETY products was 187.33 MB, decreasing by 4.53 MB or 2.36% compared to the same quarter of previous year, mainly due to a decrease in market prices and demand of rubber gloves, nitrile gloves and disease related products. However, SAFETY products in other categories increased in purchase orders from industrial customers in accordance with the expansion of the industrial sector and more revenue from technical and engineering safety and environment products. In addition, revenue from new customers increased from new products marketing in related to the chemical storage of hazardous chemicals and healthcare products.
The revenue from sales and services provision in CE products was 54.09 MB, decreasing by 3.27 MB or 5.69% compared to the same quarter of previous year due to the main customers in the electronics industry reducing their order quantities according production decreased. In addition, revenue decreased from the decrease in market prices and demand of rubber gloves and nitrile gloves. However, revenue from CE products increased sales from adding item products to existing customers and new products marketing in the medical industry.
The revenue from sales and services provision in the WATER products was 9.22 MB, increasing by 4.99 MB or 130.59% compared to the same quarter of previous year, mainly due to the revenue from water treatment system installation services and maintenance services increased compared to the same period of the previous year
Cost of Sales and Services
The Company’s total costs in the quarter 3/2023 were 184.55 MB, comprising of 178.85 MB cost of sales and 5.71 MB cost of rendering of services. Cost of sales decreased proportionally with lower revenue from sales and cost of services increased proportionally with higher revenue from services. Costs of sales and services accounted for 73.63% of revenue from sales and services. The Company’s gross profit was 66.09 MB, representing gross profit margin of 26.37%.
Distribution Costs and Administrative Expenses
In the quarter 3/2023, distribution costs and administrative expenses were 48.54 MB, consisting distribution costs of 25.88 MB, administrative expenses of 22.25 MB and loss on exchange rate of 0.41 MB. Distribution costs and administrative expenses decreasing by 1.59 MB or 3.17% with administrative expenses and loss on exchange rate decreasing, however, distribution costs were increase mainly from advertising and exhibition expenses.
The company’s financial cost was 0.56 MB, decreasing by 0.14 MB or 20.34% compared to financial cost of 0.70 MB in the same quarter of previous year.
Other Transaction
In the quarter 3/2023, the Company recorded loss arising from bad debt of financial assets of 0.62 MB, allowance for credit loss on financial assets-net of 0.10 MB and share of profit form investment in joint ventures of 0.20 MB.
Net profit
In the quarter 3/2023, the company’s consolidate net profit attributable to equity holders was 14.62 MB, accounted for net profit margin 5.80%. Net profit increasing by 0.11 MB or 0.76% compared to net profit attributable to equity holders of 14.51 MB, accounted for net profit margin 5.70% in the same quarter of previous year.
Financial Position
Unit : MB
| September 30, 2023 | December 30, 2022 | Increased (Decreased) |
% Change | |||
|---|---|---|---|---|---|---|
| Amount | % | Amount | % | |||
| Current Assets | 474.01 | 72.74% | 455.95 | 71.37% | 18.05 | 3.96% |
| Non-Current Assets | 177.68 | 27.26% | 182.87 | 28.63% | (5.19) | -2.84% |
| Total Assets | 651.68 | 100.00% | 638.82 | 100.00% | 12.86 | 2.01% |
| Current Liabilities | 256.17 | 39.23% | 241.89 | 37.79% | 14.28 | 5.90% |
| Non-Current Liabilities | 39.59 | 6.06% | 43.36 | 6.77% | (3.77) | -8.69% |
| Total Liabilities | 295.76 | 45.29% | 285.25 | 44.56% | 10.51 | 3.68% |
| Shareholder's Equity of the Company | 357.22 | 54.71% | 354.87 | 55.44% | 2.35 | 0.66% |
Assets
As of September 30, 2023, the Company’s total assets were 651.68 MB, increasing by 12.86 MB or 2.01% from December 31, 2022. The assets increased from current assets, increasing by 18.05 MB or 3.96%, mainly from trade and other current receivables-net increased by 15.17 MB, most of which were receivables that had not yet been due. Cash and cash equivalents increased by 2.98 MB.
Non-current assets decreased by 5.19 MB or 2.84%, mainly from deferred tax assets - net decreased by 1.56 MB, investments in joint venture decrease by 1 MB and property, plant and equipment-net decreased by 1.18 MB from depreciation and amortization for the period by 5.49 MB, however, buildings and equipment increasing from solar rooftop installation of 2.96 MB, office building improvement and purchase equipment of 1.35 MB. Investment properties-net and right-of use assets-net mainly decreased from depreciation and amortization of 1.31 MB.
Liabilities
As of September 30, 2023, the Company’s total liabilities were 295.76 MB, increasing by 10.51 MB or 3.68% from December 31, 2022. Current liabilities increased mainly from trade payable increased by 46.98 MB, while, others current payable-net decreased by 4.14 MB. And short-term loans from financial institutions decreased 25.53 MB, current portion of long-term loan from financial institutions decreased 0.62 MB and defer tax assets-net decreased by 2.54 MB.
Non-current liabilities decreased mainly from non-current provisions for employee benefit of 2.43 MB and lease liabilities decreased 1.33 MB.
Shareholder's equity
As of September 30, 2023, Shareholders’ equity of the Company was 357.22 MB, increasing by 2.35 MB or 0.66% from December 31, 2022. Shareholders’ equity increased from 41.33 MB of net profit for the period and 3.62 MB of other comprehensive income, while shareholders’ equity decreased mainly from dividend payment of 42.53 MB.
Cash Flows
Unit : MB
| Cash Flows | September 30, 2023 | September 30, 2022 |
|---|---|---|
| Cash flow from (used in) operating activities | 76.38 | 19.66 |
| Cash flow from (used in) investing activities | (1.58) | (16.93) |
| Cash flow from (used in) financing activities | (71.45) | (11.72) |
| Net increase (decrease) in cash and cash equivalents | 3.06 | (8.99) |
| Cash and cash equivalents at the end of the period | 56.54 | 49.55 |
For the nine month period, ending September 30, 2023, the Company’s net cash from the operating activities was 76.39 MB, with operating profits prior to changes in the operating assets and liabilities of 65.15 MB. Cash flow increased from trade and other payables increased by 39.41 MB. While, cash flow decreased from trade and other current receivables increased by 15.33 MB, payment for employee benefit of 0.61 MB, payment for income tax 6.51 MB, however, cash received from income tax return of 0.98 MB.
Cash flow used in investment activities was 1.58 MB to install solar rooftop of 2.96 MB, office building improvement and purchase equipment of 1.35 MB and purchase computer software of 0.45 MB. While, cash flow received from return of capital of investment in joint venture by 2 MB and loan to employees of 0.49 MB and interest received of 0.57 MB.
Cash flow used in financing activities was 71.75 MB to repayment of short-term loan from financial institutions of 25.53 MB, repayment of long-term loans from financial institutions of 0.62 MB, repayment of liabilities under lease agreement of 1.51 MB, interest expense of 1.51 MB and dividend payment of 42.58 MB.
Management Discussion & Analysis (MD&A) Quarter 2/2023
Overview
Referring to the operating performance in the consolidated financial statement in the second quarter, ending June 30, 2023, Phol Dhanya PCL (the Company)’s total revenue from sales and services were 239 MB, which were similar compared to the same quarter of the last year with revenue from sales and services of 240.75 MB, decreasing by 1.76 MB or 0.73% YoY. Revenue from Occupational Safety, Health and Environment Products or ‘SAFETY’ and Control Environment Product or ‘CE’ were decrease mainly due to a significant drop in market prices and demand of rubber gloves, nitrile gloves and disease related products. However, SAFETY and CE products used in the industrial sector are still securing a continuous increase in purchase orders in pursuit of the expansion of the manufacturing sector in key industries, in addition, the revenue increased from new customers and new products marketing. Furthermore, revenue from Water Solution Products or WATER increased from sales of products and equipment for construction project of a solid waste management centre of the joint venture and revenue from maintenance services increased compared to the same period of the previous year.
The gross profit increased due to adding new products and increases of selling price in some product categories, in addition, the proportion of sales of products with high gross profit margins increased. As the result, the company’s gross profit was 64.07 MB, representing gross profit margin of 26.81% in the second quarter of 2023, compare with gross profit of 60.57 MB, representing gross profit margin of 25.16% in the same quarter of previous year.
Distribution costs and administrative expenses increased mainly from traveling allowance, advertising expenses and product donations expenses. The Company’s net profit for the second quarter of 2023 was 14.06 MB; equivalent to 5.8%, increasing by 3.5 MB or 33.12% YoY at 10.56 MB; equivalent to 4.38%.
For the six months period, ending June 30, 2023, the Company’s total revenue from sales and services were 479.93 MB, decreasing by 37.36 MB or 7.22% YoY at 517.29 MB. The Company’s consolidate net profit attributable to equity holders of 26.71 MB, representing a net profit margin of 5.52%.
Operating performance
Unit : MB
| Q2/2023 | Q2/2022 | Increased (Decreased) |
% YoY | |
|---|---|---|---|---|
| Revenue from sales | 235.30 | 237.87 | (2.57) | -1.08% |
| Revenue from rendering of services | 3.70 | 2.88 | 0.82 | 28.31% |
| Revenue of water treatment system installation | - | - | - | |
| Total Revenues | 239.00 | 240.75 | (1.76) | -0.73% |
| Cost of sales | (172.54) | (178.56) | (6.02) | -3.37% |
| Cost of services | (2.39) | (1.62) | 0.77 | 47.29% |
| Cost of water treatment system installation | - | - | - | |
| Total Costs | (174.93) | (180.19) | (5.25) | -2.92% |
| Gross Profit | 64.07 | 60.57 | 3.50 | 5.77% |
| Gross Profit Margin (%) | 26.81% | 25.16% | ||
| Other income | 3.49 | 0.15 | 3.34 | 2166.23% |
| Total Distribution costs and Administrative expenses | (50.49) | (46.29) | 4.20 | 9.07% |
| Profit before finance costs and income taxes | 17.07 | 14.43 | 2.64 | 18.27% |
| Profit before finance costs and income taxes (%) | 7.04% | 5.99% | ||
| Finance Costs | (0.45) | (0.69) | (0.24) | -34.45% |
| Loss from impairment of trade and other receivables | (3.60) | - | 3.60 | |
| Reversal of allowance for credit loss (credit loss) on trade and other receivables-nets | 4.16 | 0.03 | 4.13 | 12900.00% |
| Share of profit form investment in joint ventures | 0.61 | - | 0.61 | |
| Income tax expenses | (3.73) | (3.22) | 0.51 | 15.85% |
| Profit attributable to equity holders | 14.06 | 10.56 | 3.50 | 33.12% |
| Net profit margin (%) | 5.80% | 4.38% | ||
| Basic earnings per share (Baht) | 0.07 | 0.05 | 0.02 | 33.12% |
Revenue
Unit : MB
| Q2/2023 | % | Q2/2022 | % | Increased | % | |
|---|---|---|---|---|---|---|
| Occupational Safety, Health and Environment Products (SAFETY) | 177.51 | 74.27% | 180.99 | 75.18% | (3.48) | -1.92% |
| Control Environment Products (CE) | 53.80 | 22.51% | 57.07 | 23.70% | (3.27) | -5.73% |
| Water Solution Products (WATER) | 7.69 | 3.22% | 2.70 | 1.12% | 4.99 | 184.85% |
| Total revenue from sales and services | 239.00 | 100% | 240.75 | 100% | (1.76) | -0.73% |
The total revenue from sales and services provision in the second quarter of 2023 were 239 MB, with 177.51 MB of Occupational Safety, Health and Environment Products or ‘SAFETY’, accounting for 74.27%, 53.8 MB of Control Environment Products or ‘CE’, accounting for 22.51% and 7.69 MB of Water Solution Products or ‘WATER’, accounting for 3.22%.
The revenue from sales and services provision in SAFETY products was 177.51 MB, decreasing by 3.48 MB or 1.92% compared to the same quarter of previous year, mainly due to a decrease in market prices and demand of rubber gloves, nitrile gloves and disease related products. However, SAFETY products in other categories increased in purchase orders from industrial customers in accordance with the expansion of the industrial sector and more revenue from technical and engineering safety and environment products and new products in related to the chemical storage of hazardous chemicals and healthcare products.
The revenue from sales and services provision in CE products was 53.8 MB, decreasing by 3.27 MB or 5.73% compared to the same quarter of previous year due to a decrease in market prices and demand of rubber gloves and nitrile gloves. However, revenue from CE products increased sales from new products marketing in the medical industry.
The revenue from sales and services provision in the WATER products was 7.69 MB, increasing by 4.99 MB or 184.85% compared to the same quarter of previous year, mainly due to the revenue from sales of products and equipment for construction project of a solid waste management centre of the joint venture and revenue from maintenance services increased compared to the same period of the previous year.
Cost of Sales and Services
The Company’s total costs in the second quarter of 2023 were 174.93 MB, comprising of 172.54 MB cost of sales and 2.39 MB cost of rendering of services. Cost of sales and services decreased proportionally with lower revenue from sales and services. In the second quarter of 2023, costs of sales and services accounted for 73.19% of revenue from sales and services. The Company’s gross profit was 64.07 MB, representing gross profit margin of 26.81%. Gross profit increased by 3.5 MB or 5.77%, compare with gross profit of 60.57 MB, representing gross profit margin of 25.16% in the same quarter of previous year, due to adding new products and increases of selling price in some product categories, in addition, the proportion of sales of products with high gross profit margins increased.
Distribution Costs and Administrative Expenses
In the second quarter of 2023, Distribution costs and administrative expenses were 50.49 MB, consisting distribution costs of 25.30 MB, administrative expenses of 23.69 MB and loss on exchange rate of 1.5 MB. Distribution costs and administrative expenses increasing by 4.2 MB or 9.07% compared with distribution costs and administrative expenses of 46.29 MB in the same quarter of the last year. Distribution costs were increase mainly from travelling allowance of salespersons, advertising and marketing expenses and product donations expenses to hospitals and educational institutions. Administrative expenses were increase mainly from welfare and training expenses of employee.
The company’s financial cost was 0.45 MB, decreasing by 0.24 MB or 34.45% compared to financial cost of 0.69 MB in the same quarter of previous year.
Other Transaction
In the second quarter of 2023, the Company recorded loss arising from bad debt of trade and other receivables of 3.6 MB, the reversal of allowance for credit loss on trade and other receivables-nets of 4.16 MB and share of profit form investment in joint ventures of 0.61 MB.
Net profit
In the second quarter of 2023, the company’s consolidate net profit attributable to equity holders was 14.06 MB, accounted for net profit margin 5.8%. Net profit increasing by 3.5 MB or 33.12% compared to net profit attributable to equity holders of 10.56 MB, accounted for net profit margin 4.38% in the same quarter of previous year.
Financial Position
Unit : MB
| June 30, 2023 | June 30, 2022 | Increased (Decreased) |
% Change | |||
|---|---|---|---|---|---|---|
| Amount | % | Amount | % | |||
| Current Assets | 432.94 | 70.45% | 455.95 | 71.37% | -23.01 | -5.05% |
| Non-Current Assets | 181.61 | 29.55% | 182.87 | 28.63% | -1.25 | -0.68% |
| Total Assets | 614.56 | 100.00% | 638.82 | 100.00% | -24.26 | -3.80% |
| Current Liabilities | 215.57 | 35.00% | 241.89 | 37.79% | -26.32 | -10.88% |
| Non-Current Liabilities | 39.43 | 6.40% | 43.36 | 6.77% | -3.93 | -9.07% |
| Total Liabilities | 255.00 | 41.41% | 285.25 | 44.56% | -30.25 | -10.61% |
| Shareholder's Equity of the Company | 360.86 | 58.59% | 354.87 | 55.44% | 5.99 | 1.69% |
Assets
As of June 30, 2023, the Company’s total assets were 614.56 MB, decreasing by 24.26 MB or 3.8% from December 31, 2022. The assets decreased mainly from current assets, which decreasing by 32.31 MB of net-inventories and cash and cash equivalents decreased by 8.31 MB. However, trade and other current receivables-net increase of 18.07 MB, most of which were receivables that had not yet been due.
Non-current assets increased mainly from property, plant and equipment increased from solar rooftop installation of 2.96 MB, office building improvement and purchase equipment of 1.04 MB and purchase computer software of 0.45 MB. In addition, investments in joint venture increase of 0.8 MB. However, property, plant and equipment-net mainly decreased from depreciation and amortization of 4.43 MB.
Liabilities
As of June 30, 2023, the Company’s total liabilities were 255 MB, decreasing by 30.25 MB or 10.61% from December 31, 2022. The Liabilities decreased mainly from short-term loans from financial institutions decreased 44.86 MB, current portion of long-term loan from financial institutions decreased 0.62 MB and other payables decreased 8.89 MB. However, trade payable increased 27.87 MB. Non-current liabilities decreased mainly from non-current provisions for employee benefit of 3.05 MB and lease liabilities decreased 0.88 MB.
Shareholder's equity
As of June 30, 2023, Shareholders’ equity of the Company was 360.86 MB, increasing by 5.99 MB or 1.69% from December 31, 2022. Shareholders’ equity increased from 26.71 MB of net profit for the period and 3.64 MB of other comprehensive income, while shareholders’ equity decreased from dividend payment of 24.3 MB.
Cash Flows
Unit : MB
| Cash Flows | June 30, 2023 | June 30, 2022 |
|---|---|---|
| Cash flow from (used in) operating activities | 67.23 | 21.34 |
| Cash flow from (used in) investing activities | -3.65 | -5.24 |
| Cash flow from (used in) financing activities | -71.85 | 5.36 |
| Net increase (decrease) in cash and cash equivalents | -8.27 | 21.46 |
| Cash and cash equivalents at the end of the period | 45.25 | 80.10 |
For the six month period, ending June 30, 2023, the Company’s net cash from the operating activities was 67.23 MB, with operating profits prior to changes in the operating assets and liabilities of 42.41 MB. Cash flow increased from inventories decreased 32.03 MB and trade and other payables increased 16.11 MB. While, cash flow decreased from net- trade and other payables increased 16.92 MB.
Cash flow used in investment activities was 3.65 MB to install solar rooftop of 2.96 MB, office building improvement and purchase equipment of 1.04 MB and purchase computer software of 0.45 MB. While, cash flow acquired from loan to employees of 0.58 MB and interest received of 0.25 MB.
Cash flow used in financing activities was 71.85 MB to repayment of short-term loan from financial institutions amount of 44.87 MB, repayment of long-term loans from financial institutions of 0.62 MB, repayment of liabilities under lease agreement of 1.01 MB, interest expense of 1.01 MB and dividend payment of 24.36 MB.
Management Discussion & Analysis (MD&A) Quarter 1/2023
Overview
Referring to the operating performance in the consolidated financial statement in the first quarter, ending March 31, 2023, Phol Dhanya PCL (the Company)’s total revenue from sales and services were 240.93 MB, decreasing by 35.61 MB or 12.88% YoY at 276.54 MB. The decline in revenue is mainly from Occupational Safety, Health and Environment Products or ‘SAFETY’ due to a significant drop in market prices and demand of rubber gloves, nitrile gloves and disease related products. Furthermore, revenue from WATER products decreased from sales of equipment for waste landfill construction project in the same quarter of previous year. The gross profit decreased in line with lower revenue from sales and services, however, the gross profit margin increased due to adding new products and increases of selling price in some product categories, in addition, the proportion of sales of products with high gross profit margins increased. The first quarter of 2023, the company’s gross profit was 65.28 MB, representing gross profit margin of 27.10%, compare with gross profit of 68.39 MB, representing gross profit margin of 24.73% in the same quarter of previous year.
Distribution costs and administrative expenses slightly increased, compared to the same quarter of the previous year. The Company’s net profit for the first quarter of 2023 was 12.65 MB; equivalent to 5.24%, decreasing by 4.46 MB or 26.05% YoY at 17.11 MB; equivalent to 6.14%.
Operating performance
Unit : MB
| Q1/2023 | Q1/2022 | Increased (Decreased) |
% YoY | |
|---|---|---|---|---|
| Revenue from sales | 235.20 | 270.29 | (35.09) | (12.98%) |
| Revenue from rendering of services | 5.40 | 6.24 | (0.84) | (13.44%) |
| Revenue of water treatment system installation | 0.32 | - | 0.32 | |
| Total Revenues | 240.93 | 276.54 | (35.61) | (12.88%) |
| Cost of sales | (171.05) | (203.50) | (32.46) | (15.95%) |
| Cost of services | (4.36) | (4.64) | (0.29) | (6.17%) |
| Cost of water treatment system installation | (0.24) | - | 0.24 | |
| Total Costs | (175.65) | (208.15) | (32.50) | (15.62%) |
| Gross Profit | 65.28 | 68.39 | (3.10) | (4.54%) |
| Gross Profit Margin (%) | 27.10% | 24.73% | ||
| Other income | 0.70 | 2.07 | (1.37) | (66.33%) |
| Total Distribution costs and Administrative expenses | (49.59) | (48.39) | 1.20 | 2.49% |
| Profit before finance costs and income taxes | 16.39 | 22.07 | (5.68) | (25.73%) |
| Profit before finance costs and income taxes (%) | 6.79% | 7.92% | ||
| Finance Costs | (0.63) | (0.58) | 0.05 | 8.01% |
| Reversal of allowance for credit loss (credit loss) on trade and other receivables-nets | 0.04 | (0.01) | 0.04 | |
| Share of profit form investment in joint ventures | 0.19 | - | 0.19 | |
| Income tax expenses | (3.35) | (4.37) | (1.02) | (23.42%) |
| Profit attributable to equity holders | 12.65 | 17.11 | (4.46) | (26.05%) |
| Net profit margin (%) | 5.24% | 6.14% | ||
| Basic earnings per share (Baht) | 0.06 | 0.08 | (0.02) | (26.05%) |
Revenue
Unit : MB
| Q1/2023 | % | Q1/2022 | % | Increased | % | |
|---|---|---|---|---|---|---|
| Occupational Safety, Health and Environment Products (SAFETY) | 179.86 | 74.65% | 201.98 | 73.04% | (22.11) | (10.95%) |
| Control Environment Products (CE) | 55.48 | 23.03% | 55.53 | 20.08% | (0.05) | (0.09%) |
| Water Solution Products (WATER) | 5.59 | 2.32% | 19.03 | 6.88% | (13.44) | (70.62%) |
| Total revenue from sales and services | 240.93 | 100% | 276.54 | 100% | (35.61) | (12.88%) |
The total revenue from sales and services provision in the first quarter of 2023 were 240.93 MB, with 179.86 MB of Occupational Safety, Health and Environment Products or SAFETY accounting for 74.65%, 55.48 MB of Control Environment Products or CE accounting for 23.03% and 5.59 MB of Water Solution Products or WATER accounting for 2.32%.
The revenue from sales and services provision in SAFETY products was 179.86 MB, decreasing by 22.11 MB or 10.95% compared to the same quarter of previous year, mainly due to a decrease in market prices and demand of rubber gloves, nitrile gloves and disease related products. However, SAFETY products in other categories increased in purchase orders from industrial customers in accordance with the expansion of the industrial sector.
The revenue from sales and services provision in CE products was 55.48 MB, similar to the same period of the previous year. Major customers in the electronics industry have decreased production due to the shortage of raw materials, however, the CE products has increased sales from new products marketing in the electronics industry and medical industry.
The revenue from sales and services provision in the WATER products was 5.59 MB, decreasing by 13.44 MB or 70.62% compared to the same quarter of previous year, mainly due to the revenue from sales of equipment for waste landfill construction project, in collaboration with a business partner in the same quarter of previous year.
Cost of Sales and Services
The Company’s total costs in quarter 1/2023 were 175.65 MB, comprising of 171.05 MB cost of sales, 4.36 MB cost of rendering of services and 0.24 MB of cost of water treatment system installation. Cost of sales and services decreased proportionally with lower revenue from sales and services. In quarter 1/2023, costs of sales and services accounted for 72.90% of revenue from sales and services. The Company’s gross profit was 65.28 MB, decreased by 3.10 MB or 4.54% due to lower revenue from sales and services. However, gross profit margin was 27.10%, increase from the same quarter last year with a gross profit margin of 24.73%.
Distribution Costs and Administrative Expenses
In Quarter 1/2023, Distribution costs and administrative expenses were 49.59 MB, consisting distribution costs of 25.86 MB and administrative expenses of 23.73 MB. Distribution costs and administrative expenses were similar compared to the same quarter of the last year, the expenses were increase, mainly from salary and employee welfare, travelling allowance of salespersons and product donations expenses to hospitals and medical facilities. However, there was decreasing expenses in line with lower revenue from sales and services such as sales commissions.
The company’s financial cost was 0.63 MB, increasing by 0.05 MB or 8.01% compared to financial cost of 0.58 MB in the same quarter of previous year.
Other Transaction
In Quarter 1/2023, the Company recorded the reversal of allowance for credit loss on trade and other receivables-nets of 0.04 MB and share of profit form investment in joint ventures of 0.19 MB, while, there was credit loss from impairment on trade and other receivables-nets of 0.01 MB in the same quarter of previous year.
Net profit
In Quarter 1/2023, the company’s consolidate net profit attributable to equity holders was 12.65 MB, accounted for net profit margin 5.24%, decreasing by 4.46 MB or 26.05% compared to net profit attributable to equity holders of 17.11 MB, accounted for net profit margin 6.14% in the same quarter of previous year.
Financial Position
Unit : MB
| March 31, 2023 | March 31, 2022 | Increased (Decreased) |
% Change | |||
|---|---|---|---|---|---|---|
| Amount | % | Amount | % | |||
| Current Assets | 407.23 | 69.28% | 455.95 | 71.37% | (48.72) | (10.69%) |
| Non-Current Assets | 180.62 | 30.72% | 182.87 | 28.63% | (2.25) | (1.23%) |
| Total Assets | 587.85 | 100.00% | 638.82 | 100.00% | (50.97) | (7.98%) |
| Current Liabilities | 178.89 | 30.36% | 241.89 | 37.79% | (63.00) | (26.05%) |
| Non-Current Liabilities | 39.10 | 6.64% | 43.36 | 6.77% | (4.26) | (9.83%) |
| Total Liabilities | 217.99 | 37.00% | 285.25 | 44.56% | (67.26) | (23.58%) |
| Shareholder's Equity of the Company | 371.16 | 63.00% | 354.87 | 55.44% | 16.29 | 4.59% |
Assets
As of March 31, 2023, the Company’s total assets were 587.85 MB, decreasing by 50.97 MB or 7.98% from December 31, 2022. The assets decreased mainly from current assets, which decreasing by 42.98 MB of net-inventories and cash and cash equivalents decreased by 18.57 MB. However, trade and other current receivables-net increase of 11.89 MB, most of which were receivables that had not yet been due.
Liabilities
As of March 31, 2023, the Company’s total liabilities were 217.99 MB, decreasing by 67.26 MB or 23.58% from December 31, 2022. The Liabilities decreased mainly from the decrease of 46.31 MB of short-term loans from financial institutions and trade and other payables decreased by 19.26 MB. However, current income tax payable increased by 3.07 MB. Non-current liabilities decreased mainly from non-current provisions for employee benefit of 3.82 MB.
Shareholder's equity
As of March 31, 2023, Shareholders’ equity of the Company was 371.16 MB, increasing by 16.29 MB or 4.59% from December 31, 2022 from 12.65 MB of net profit for the period and 3.64 MB of other comprehensive income.
Cash Flows
Unit : MB
| Cash Flows | March 31, 2023 | March 31, 2022 |
|---|---|---|
| Cash flow from (used in) operating activities | 31.55 | (22.35) |
| Cash flow from (used in) investing activities | (2.10) | (0.59) |
| Cash flow from (used in) financing activities | (48.03) | 32.31 |
| Net increase (decrease) in cash and cash equivalents | (18.59) | 9.37 |
| Cash and cash equivalents at the end of the period | 34.99 | 68.09 |
For the three month period, ending March 31, 2023, the Company’s net cash from the operating activities was 31.55 MB, with operating profits prior to changes in the operating assets and liabilities of 20.92 MB. Cash flow increased from inventories decreased 42.27 MB. While, cash flow decreased from trade and other receivables increased 11.03 MB and net- trade and other payables decreased 19.94 MB.
Cash flow used in investment activities was 2.10 MB for short-term loans to the subsidiary in amount of 1.50 MB and purchase fix assets and intangible assets of 0.68 MB and 0.45 MB respectively. While, cash flow acquired 0.43 MB from loan to employees and interest received of 0.11 MB.
Cash flow used in financing activities was 48.03 MB to repayment of short-term loan from financial institutions amount of 46.31 MB, repayment of long-term loans from financial institutions of 0.62 MB, repayment of liabilities under lease agreement of 0.50 MB and interest expense of 0.60 MB.
Management Discussion & Analysis (MD&A) Yearly 2022
Overview
Referring to the operating performance in the consolidated financial statement for the year, ending December 31, 2022, Phol Dhanya PCL (the Company)’s total revenue from sales and services were 1,000.48 MB, decreasing by 225.28 MB or 18.38% YoY at 1,225.76 MB. The decline in revenue is mainly from the significant drop in market prices and demand for rubber and nitrile gloves, compared with the last year that still in the situation of the epidemic of the COVID virus that has demand for products in both industrial and medical sectors. Furthermore, the sales revenue from COVID related products also decreased in accordance with the intensity of the spread. However, the overall economy and production in the industrial sector are expanding and there is still an increase in orders among those customers. The gross profit decreased in line with lower revenue from sales and services, however, the gross profit margin increased due to effectively cost management and adjustment of selling price increases according to the cost price of certain products and the proportion of sales of products with high gross profit margins increased. In 2022, the Company’s gross profit was 257.74 MB, representing gross profit margin of 25.76%, compared to gross profit of 287.59 MB, representing gross profit margin of 23.46% in previous year. Distribution costs and administrative expenses were decrease from previous year. For the year 2022, the Company’s net profit attributable to equity holders of 54.04 MB, representing a net profit margin of 5.39%.
Operating performance
Unit : MB
| Y2022 | Y2021 | Increased (Decreased) |
% YoY | |
|---|---|---|---|---|
| Revenue from sales | 984.36 | 1,203.45 | -219.09 | -18.21% |
| Revenue from services | 16.12 | 22.31 | -6.19 | -27.73% |
| Total Revenues | 1,000.48 | 1,225.76 | -225.28 | -18.38% |
| Cost of sales | -732.12 | -921.75 | -189.64 | -20.57% |
| Cost of services | -10.63 | -16.42 | -5.79 | -35.29% |
| Total Costs | -742.74 | -938.17 | -195.43 | -20.83% |
| Gross Profit | 257.74 | 287.59 | -29.85 | -10.38% |
| Gross Profit Margin (%) | 25.76% | 23.46% | ||
| Other income | 2.86 | 4.06 | -1.21 | -29.69% |
| Total Distribution costs and Administrative expenses | -187.69 | -191.77 | -4.08 | -2.13% |
| Profit before finance costs and income taxes | 72.91 | 99.89 | -26.98 | -27.01% |
| Profit before finance costs and income taxes (%) | 7.27% | 8.12% | ||
| Financial Cost | -2.82 | -2.76 | 0.06 | 2.11% |
| Loss from impairment of trade and other receivables | - | -0.7 | -0.7 | -100.00% |
| Reversal of allowance for credit loss (credit loss) on trade and other receivables-nets | -1.17 | 5.81 | -4.64 | -79.93% |
| Share of loss form investment in joint ventures | -0.27 | - | 0.27 | |
| Income tax expenses | -14.62 | -20.34 | -5.73 | -28.14% |
| Profit attributable to equity holders | 54.04 | 81.89 | -27.86 | -34.02% |
| Net profit margin (%) | 5.39% | 6.66% | ||
| Basic earnings per share (Baht) | 0.27 | 0.4 | -0.14 | -34.02% |
Revenue
Unit : MB
| Y2022 | % | Y2021 | % | Increased | % | |
|---|---|---|---|---|---|---|
| Occupational Safety, Health and Environment Products (SAFETY) | 746.81 | 74.65% | 889.88 | 72.60% | -143.07 | -16.08% |
| Control Environment Products (CE) | 222.69 | 22.26% | 305.75 | 24.94% | -83.06 | -27.17% |
| Water Solution Products (WATER) | 30.97 | 3.10% | 30.13 | 2.46% | 0.85 | 2.81% |
| Total revenue from sales and services | 1,000.48 | 100% | 1,225.76 | 100% | -225.28 | -18.38% |
In 2022, the total revenue from sales and services provision were 1,000.48 MB, with 746.81 MB of Occupational Safety, Health and Environment Products or SAFETY accounting for 74.65%, 222.69 MB of Control Environment Products or CE accounting for 22.26% and 30.97 MB of Water Solution Products or WATER accounting for 3.10%.
The revenue from sales and services provision in SAFETY products was 746.81 MB, decreasing by 143.07 MB or 16.08% compared to the previous year, mainly due to a decrease in market prices of rubber and nitrile gloves, coupled with lower purchase orders from distributors and medical sectors. In addition, the revenue from COVID-19 preventive equipment also dropped in relation to the intensity of the situation. However, SAFETY products in other categories are still generating a continuous increase in purchase orders both from existing customer bases and new customers in accordance with the expansion of the industrial sector.
The revenue from sales and services provision in CE products was 222.69 MB, has also dropped by 83.06 MB or 27.17% due to a decrease in market prices of rubber and nitrile gloves, and the quantity of orders decreased both in the key customers in the electronics industry and distributor customers compared to the last year when there was a product shortage caused by COVID-19, the customers have increased purchase orders to accumulate the inventory. However, the CE product has increased sales from new products marketing in the electronics industry and medical device industry.
The revenue from sales and service provision in the WATER products was 30.97 MB, similar to the previous year. Revenue from WATER products increased from sales of equipment for waste landfill construction, in collaboration with a business partner. However, revenue from construction projects of water treatment systems decreased mainly due to the impact of COVID-19, customers have decided to delay or cancel the water treatment projects.
Cost of Sales and Services
In 2022, the Company’s total costs were 742.74 MB, comprising of 732.12 MB cost of sales and 10.63 MB cost of services. Cost of sales and services decreased proportionally with lower revenue from sales and services, however, the cost of some products has been increased by manufacturers and the effect of depreciation of Baht.
Costs of sales and services accounted for 74.24% of revenue from sales and service. The Company’s gross profit was 257.74 MB, decreased by 29.85 MB or 10.38% due to lower revenue from sales and services. However, gross profit margin was 25.76%, increase from the last year with a gross profit margin of 23.46% due to effectively cost management and adjustment of the selling price increases according to the cost price, moreover the proportion of sales of products with high gross profit margins increased.
Distribution Costs and Administrative Expenses
In 2022, distribution costs and administrative expenses were 187.69 MB comprised 93.01 MB of distribution costs, 93.19 MB of administrative expenses and 1.49 MB of loss on exchange rate. Distribution costs increased mainly from sales and marketing activities compared to the previous year in the epidemic situation and transportation and traveling expenses in line with oil prices. Administrative expenses were increase, mainly from the employee compensation and the employee welfare and product donations expenses related to situation of the epidemic of COVID-19 decreased. And loss on exchange rate decreased compared to the previous year.
The company’s financial cost was 2.82 MB, similar to the previous year with financial cost of 2.76 MB.
Net Profit
In 2022, the company’s consolidate net profit attributable to equity holders was 54.04 MB, accounted for net profit margin 5.39%, decreasing by 27.86 MB or 34.02% compared to net profit attributable to equity holders of 81.89 MB, accounted for net profit margin 6.66% in the previous year.
Financial Position
Unit : MB
| December 31, 2022 | December 31, 2021 | Increased (Decreased) |
% Change | |||
|---|---|---|---|---|---|---|
| Amount | % | Amount | % | |||
| Current Assets | 455.95 | 71.37% | 461.67 | 72.56% | -5.72 | -1.24% |
| Non-Current Assets | 182.87 | 28.63% | 174.56 | 27.44% | 8.31 | 4.76% |
| Total Assets | 638.82 | 100.00% | 636.23 | 100.00% | 2.59 | 0.41% |
| Current Liabilities | 241.89 | 37.79% | 246.31 | 38.63% | -4.41 | -1.79% |
| Non-Current Liabilities | 43.36 | 6.77% | 41.76 | 6.55% | 1.6 | 3.84% |
| Total Liabilities | 285.25 | 44.56% | 288.06 | 45.18% | -2.81 | -0.98% |
| Shareholder's Equity of the Company | 354.87 | 55.44% | 349.47 | 54.82% | 5.4 | 1.55% |
Assets
As of December 31, 2022, the Company’s total assets were 638.82 MB, increasing by 2.59 MB or 0.41% from December 31, 2021. Current assets increased from 23.15 MB of net-inventories and 2.94 MB of short-term loans to joint ventures. However, cash and cash equivalents decreasing by 5.16 MB and trade receivables-net decreased 25.43 MB. Non-current assets mainly increased from investments in joint venture of 10 MB and right-of-use office equipment of 3.40 MB. However, non-current assets decreasing by 8.21 MB from depreciation and amortization.
Liabilities
As of December 31, 2022, the Company’s total liabilities were 285.25 MB, decreasing by 2.81 MB or 0.98% from December 31, 2021. The Liabilities decreased mainly from 38.34 MB of trade and other payables, 6.53 MB of current portion of long-term loan from financial institution-net and 3.09 MB of current income tax payable. However, current liabilities increasing by 42.81 from short-term loans from financial institutions to pay for goods and working capital. Non-current asset mainly increased from lease liabilities 1.46 MB and non-current provisions for employee benefit 0.87 MB.
Shareholder’s equity
As of December 31, 2022, Shareholders’ equity of the Company was 354.87 MB, increasing by 5.40 MB or 1.55% from December 31, 2021. The shareholders' equity increased from the net profit for the period of 54.04 MB, however, shareholders' equity decreased from dividend payment of 48.60 MB and appropriated to legal reserve of 2.75 MB.
Cash Flows
Unit : MB
| Cash Flows | December 31, 2022 | December 31, 2022 |
|---|---|---|
| Cashflow from (used in) operating activities | 27.42 | 35.31 |
| Cashflow from (used in) investing activities | -16.04 | -4.64 |
| Cashflow from (used in) financing activities | -16.5 | (64..22) |
| Net increase (decrease) in cash and cash equivalents | -5.12 | -33.55 |
| Cash and cash equivalents at the end of the period | 53.55 | 58.71 |
For the year, ending December 31, 2022, the Company’s net cash from the operating activities was 27.42 MB, with operating profits prior to changes in the operating assets and liabilities of 78.77 MB. Cash flow increased from trade and other receivables decreased 26.07 MB. However, cash flow decreased from inventories increased 20.43 MB, net- trade and other payables decreased 37.24 MB, paid for employee benefits of 2.09 MB and paid for corporate income tax of 17.74 MB.
Cash flow used in investment activities was 16.04 MB to investment in joint ventures of 10 MB and payment for short-term loans to joint ventures of 4.49 MB, purchase fix assets and intangible assets of 3.67 MB. However, cash flow receipt from short-term loans to related party of 1.55 MB, sales fix assets 0.25 MB and interest received of 0.86 MB.
Cash flow used in financing activities was 16.50 MB to repayment of long-term loans from financial institutions 7.14 MB, repayment of liabilities under lease agreement 0.67 MB, interest expense 2.95 MB and dividend payment 48.54 MB. While, cash flow acquired from short-term loan from financial institutions amount of 42.81 MB.
Management Discussion & Analysis (MD&A) Quarter 3/2022
Overview
Referring to the operating performance in the consolidated financial statement for the third quarter, ending September 30, 2022, Phol Dhanya PCL (the Company)’s total revenue from sales and services were 253.09 MB, decreasing by 76.58 MB or 23.23% YoY at 329.67 MB. The decline in revenue is mainly from the significant drop in market prices and demand for rubber and nitrile gloves, compared with the same period of time in the last year that still in the situation of the epidemic of the COVID virus that has demand for products in both industrial and medical sectors. Furthermore, the sales revenue from COVID related products also decreased in accordance with the intensity of the spread. However, the overall economy and production in the industrial sector are expanding and there is still an increase in orders among those customers. The gross profit decreased in line with lower revenue from sales and services, however, the gross profit margin increased due to effectively cost management and adjustment of selling price increases according to the cost price of certain products and the proportion of sales of products with high gross profit margins increased. In quarter 3/2022, the Company’s gross profit was 67.97 MB, representing gross profit margin of 26.86%, compared to gross profit of 75.48 MB, representing gross profit margin of 22.90% in the same quarter of previous year. Distribution costs and administrative expenses increased in line with the operational activities that return to normal after the epidemic situation of the coronavirus and there was loss on the exchange rate.
The Company’s net profit for the third quarter of 2022 was 14.51 MB, representing a net profit margin of 5.70%. For the nine months period, ending September 30, 2022, the Company’s total revenue from sales and service were 770.38 MB, and net profit attributable to equity holders of 42.18 MB, representing a net profit margin of 5.46%.
Operating performance
Unit : MB
| Q3/2022 | Q3/2021 | Increased (Decreased) |
% YoY | |
|---|---|---|---|---|
| Revenue from sales | 249.95 | 324.09 | (74.14) | -22.88% |
| Revenue from services | 3.14 | 5.58 | (2.44) | -43.75% |
| Total Revenues | 253.09 | 329.67 | (76.58) | -23.23% |
| Cost of sales | (183.43) | (250.15) | (66.72) | -26.67% |
| Cost of services | (1.69) | (4.03) | (2.35) | -58.14% |
| Total Costs | (185.12) | (254.19) | (69.07) | -27.17% |
| Gross Profit | 67.97 | 75.48 | (7.51) | -9.95% |
| Gross Profit Margin (%) | 26.86% | 22.90% | ||
| Other income | 1.41 | 0.92 | 0.49 | 53.60% |
| Total Distribution costs and Administrative expenses | (50.14) | (45.95) | 4.18 | 9.10% |
| Profit before finance Costs and income taxes | 19.25 | 30.45 | (11.20) | -36.79% |
| Profit before finance Costs and income taxes (%) | 7.56% | 9.21% | ||
| Financial Cost | (0.70) | (0.86) | (0.16) | -18.45% |
| Reversal of impairment (Loss from impairment) on trade and other receivables-nets | (0.17) | 0.02 | 0.15 | 0.00% |
| Income tax expenses | (3.87) | (5.90) | (2.04) | -34.50% |
| Profit attributable to equity holders | 14.51 | 23.70 | (9.19) | -38.77% |
| Net profit margin (%) | 5.70% | 7.17% | ||
| Basic earnings per share (Baht) | 0.07 | 0.12 | (0.05) | -38.77% |
Revenue
Unit : MB
| Q3/2022 | % | Q3/2021 | % | Increased | % | |
|---|---|---|---|---|---|---|
| Occupational Safety, Health and Environment Products (SAFETY) | 191.86 | 75.81% | 249.64 | 75.72% | (57.78) | -23.15% |
| Control Environment Products (CE) | 57.41 | 22.68% | 69.50 | 21.08% | (12.09) | -17.39% |
| Water Solution Products (WATER) | 3.82 | 1.51% | 10.53 | 3.19% | (6.71) | -63.70% |
| Total revenue from sales and services | 253.09 | 100% | 329.67 | 100% | (76.57) | -23.23% |
The total revenue from sales and services provision in the third quarter of 2022 were 253.09 MB, with 191.86 MB of Occupational Safety, Health and Environment Products or SAFETY accounting for 75.81%, 57.41 MB of Control Environment Products or CE accounting for 22.68% and 3.82 MB of Water Solution Products or WATER accounting for 1.51%.
The revenue from sales and services provision in SAFETY products was 191.86 MB, decreasing by 57.78 MB or 23.15%, mainly due to a decrease in market prices of rubber and nitrile gloves, coupled with lower purchase orders from distributors and medical sectors, compared with the same quarter in the last year. Meanwhile, the revenue from COVID-19 preventive equipment also dropped in relation to the intensity of the situation. However, SAFETY products in other categories are still generating a continuous increase in purchase orders both from existing customer bases and new customers in accordance with the expansion of the industrial sector.
The revenue from sales and services provision in CE products was 57.41 MB, has also dropped by 12.09 MB or 17.39% due to a decrease in market prices of rubber and nitrile gloves, and the quantity of orders decreased both in the key customers in the electronics industry and distributor customers compared with the same period of last year when there was a product shortage caused by COVID-19, the customers have increased purchase orders to accumulate the inventory. However, the CE product has increased sales from new products marketing in the medical device industry.
The revenue from sales and service provision in the WATER products was 3.82 MB, decreasing by 6.71 MB or 63.70% compare to the same quarter in the last year, revenue from sales and construction projects of water treatment systems decreased mainly due to the impact of COVID-19, customers have decided to delay or cancel the water treatment projects. However, in the quarter 3/2022, the company with partners setup 2 joint ventures, namely Loy Phol Joint Venture to carry out projects for construction of a solid waste management centre for a sub district municipality and Phol SK Joint Venture to carry out projects for construction of a solar water distribution system in the Department of Water Resources.
Cost of Sales and Services
The Company’s total costs in quarter 3/2022 were 185.12 MB, comprising of 183.43 MB cost of sales and 1.69 MB cost of services. Cost of sales and services decreased proportionally with lower revenue from sales and services, however, the cost of some products has been increased by manufacturers and the effect of depreciation of Baht.
In quarter 3/2022, costs of sales and services accounted for 73.14% of revenue from sales and service. The Company’s gross profit was 67.97 MB, decreased by 7.51 MB or 9.95% due to lower revenue from sales and services. However, gross profit margin was 26.86%, increase from the same quarter last year with a gross profit margin of 22.90% due to effectively cost management and adjustment of the selling price increases according to the cost price, moreover the proportion of sales of products with high gross profit margins increased.
Distribution Costs and Administrative Expenses
In Quarter 3/2022, Distribution costs and administrative expenses were 50.14 MB comprised 24.16 MB of distribution costs, 23.19 MB of administrative expenses and 2.79 MB of loss on exchange rate. Distribution costs and administrative expenses were increase, mainly increased transportation and traveling expenses in line with oil prices and sales and marketing activities increased compared to the previous year in the epidemic situation. Meanwhile, the employee welfare and product donations expenses related to situation of the epidemic of COVID-19 decreased compared to the same quarter of the last year.
The company’s financial cost was 0.70 MB, increasing by 0.16 MB or 18.45% compared to financial cost of 0.86 MB in the same quarter of previous year.
Net profit
In Quarter 3/2022, the company’s consolidate net profit attributable to equity holders was 14.51 MB, accounted for net profit margin 5.70%, decreasing by 9.19 MB or 38.77% compared to net profit attributable to equity holders of 23.70 MB, accounted for net profit margin 7.17% in the same quarter of previous year.
Financial Position
Unit : MB
| September 30, 2022 | December 31, 2021 | Increased (Decreased) |
% Change | |||
|---|---|---|---|---|---|---|
| Amount | % | Amount | % | |||
| Current Assets | 491.50 | 72.97% | 461.67 | 72.56% | 29.83 | 6.46% |
| Non-Current Assets | 182.04 | 27.03% | 174.56 | 27.44% | 7.48 | 4.28% |
| Total Assets | 673.54 | 100.00% | 636.23 | 100.00% | 37.31 | 5.86% |
| Current Liabilities | 289.27 | 42.86% | 246.31 | 38.63% | 42.96 | 17.44% |
| Non-Current Liabilities | 42.69 | 6.33% | 41.76 | 6.55% | 0.93 | 2.24% |
| Total Liabilities | 331.96 | 49.19% | 288.06 | 45.18% | 43.89 | 15.24% |
| Shareholder's Equity of the Company | 342.88 | 50.81% | 349.47 | 54.82% | (6.58) | -1.88% |
Assets
As of September, 2022, the Company’s total assets were 673.54 MB, increasing by 37.31 MB or 5.86% from December 31, 2021. The assets increased mainly from current assets, which increasing from 46.04 MB of net-inventories and 4.49 MB of short-term loans to joint ventures. However, cash and cash equivalents decreasing by 9.16 MB and trade receivables-net decreased 11.29 MB. Non-current assets mainly increased from investments in joint venture of 10 MB.
Liabilities
As of September, 2022, the Company’s total liabilities were 331.96 MB, increasing by 43.89 MB or 15.24% from December 31, 2021. The Liabilities increased mainly from current liabilities which increase from 44.72 MB of short-term loans from financial institutions to pay for goods and working capital and trade and other payables increased by 8.60 MB. However, current portion of long-term loan from financial institution-net decreased by 4.74 MB and current income tax payable decreased by 5.34 MB.
Shareholder's equity
As of September 30, 2022, Shareholders’ equity of the Company was 342.88 MB, decreasing by 6.58 MB or 1.88% from December 31, 2021. The shareholders' equity increased from the net profit for the period of 42.18 MB, while decreased from dividend payment of 48.60 MB.
Cash Flows
Unit : MB
| Cash Flows | September 30, 2022 | September 30, 2021 |
|---|---|---|
| Cashflow from (used in) operating activities | 19.66 | (23.16) |
| Cashflow from (used in) investing activities | (16.93) | (1.17) |
| Cashflow from (used in) financing activities | (11.72) | (18.78) |
| Net increase (decrease) in cash and cash equivalents | (8.99) | (43.11) |
| Cash and cash equivalents at the end of the period | 49.55 | 49.13 |
For the nine month period, ending September 30, 2022, the Company’s net cash from the operating activities was 19.66 MB, with operating profits prior to changes in the operating assets and liabilities of 65.15 MB. Cash flow increased from trade and other receivables decreased 11.65 MB and net- trade and other payables increased 6.14 MB. However, cash flow decreased from inventories increased 45.80 MB and paid for corporate income tax of 17.57 MB.
Cash flow used in investment activities was 16.93 MB to investment in joint ventures of 10 MB and payment for short-term loans to joint ventures of 4.49 MB, purchase fix assets and intangible assets of 3.16 MB, while cash flow acquired 0.14 MB from sales fix assets and interest received of 0.69 MB.
Cash flow used in financing activities was 11.72 MB to repayment of long-term loans from financial institutions 5.36 MB, repayment of liabilities under lease agreement 0.60 MB, interest expense 1.90 MB and dividend payment 48.58 MB. While, cash flow acquired from short-term loan from financial institutions amount of 44.72 MB.
Management Discussion & Analysis (MD&A) Quarter 2/2022
Overview
Referring to the operating performance in the consolidated financial statement for the second quarter, ending June 30, 2022, Phol Dhanya PCL (the Company)’s total revenue from sales and services were 240.75 MB, decreasing by 60.09 MB or 19.97% YoY at 300.85 MB. The decline in revenue is mainly from Occupational Safety, Health and Environment Products or ‘SAFETY’ and Control Environment Products or ‘CE’, due to a significant drop in market prices of rubber and nitrile gloves, together with an excessive supply, compared with the same period of time in the last year when there was a product shortage in the supply chain, causing prices to go up. Furthermore, the sales revenue from COVID-19-related products also decreased in accordance with the intensity of the spread. However, SAFETY and CE products used in the industrial sector are still securing a continuous increase in purchase orders in pursuit of the expansion of the manufacturing sector in key industries. The gross profit decreased in line with lower revenue from sales and services, however, the gross profit margin increased due to effectively cost management and the proportion of sales of products with high gross profit margins increased with 60.57 MB of the Company’s gross profit, representing gross profit margin of 25.16%, compared to gross profit of 70.21 MB, representing gross profit margin of 23.34% in the same quarter of previous year. Distribution costs and administrative expenses were similar compared to the same quarter of the previous year. The Company’s net profit for the second quarter of 202 2 was 10.56 MB; equivalent to 4.38%, decreasing by 7.80 MB or 42.50% YoY at 18.36 MB; equivalent to 6.10%.
For the six months period, ending June 30, 2022, the Company’s total revenue from sales and service were 517.29 MB, decreasing by 106.88 MB or 17.12% YoY at 624.17 MB. The Company’s consolidate net profit attributable to equity holders of 27.67 MB, representing a net profit margin of 5.33%.
Operating performance
Unit : MB
| Q2/2022 | Q2/2021 | Increased (Decreased) |
% YoY | |
|---|---|---|---|---|
| Revenue from sales | 237.87 | 298.19 | (60.32) | -20.23% |
| Revenue from services | 2.88 | 2.65 | 0.23 | 8.56% |
| Total Revenues | 240.75 | 300.85 | (60.09) | -19.97% |
| Cost of sales | (178.56) | (228.85) | (50.29) | -21.97% |
| Cost of services | (1.62) | (1.78) | (0.16) | -8.94% |
| Total Costs | (180.19) | (230.63) | (50.45) | -21.87% |
| Gross Profit | 60.57 | 70.21 | (9.64) | -13.74% |
| Gross Profit Margin (%) | 25.16% | 23.34% | ||
| Other income | 0.15 | 0.23 | (0.07) | -31.61% |
| Total Distribution costs and Administrative expenses | (46.29) | (46.71) | (0.42) | -0.89% |
| Profit before finance Costs and income taxes | 14.43 | 23.73 | (9.30) | -39.18% |
| Profit before finance Costs and income taxes (%) | 5.99% | 7.88% | ||
| Financial Cost | (0.69) | (0.62) | 0.06 | 9.97% |
| Reversal of impairment (Loss from impairment) on trade and other receivables-nets | 0.03 | 0.70 | (0.67) | 0.00% |
| Income tax expenses | (3.22) | (4.74) | (1.52) | -32.07% |
| Profit attributable to equity holders | 10.56 | 18.36 | (7.80) | -42.50% |
| Net profit margin (%) | 4.38% | 6.10% | ||
| Basic earnings per share (Baht) | 0.05 | 0.09 | (0.04) | -42.50% |
Revenue
Unit : MB
| Q2/2022 | % | Q2/2021 | % | Increased | % | |
|---|---|---|---|---|---|---|
| Occupational Safety, Health and Environment Products (SAFETY) | 180.99 | 75.18% | 223.29 | 74.22% | (42.30) | -18.94% |
| Control Environment Products (CE) | 57.07 | 23.70% | 74.36 | 24.72% | (17.29) | -23.25% |
| Water Solution Products (WATER) | 2.70 | 1.12% | 3.20 | 1.06% | (0.50) | -15.70% |
| Total revenue from sales and services | 240.75 | 100% | 300.85 | 100% | (60.09) | -19.97% |
The total revenue from sales and service provision in the second quarter of 202 2 were 240.75 MB, with 180.99 MB of Occupational Safety, Health and Environment Products or SAFETY accounting for 75.18%, 57.07 MB of Control Environment Products or CE accounting for 23.70% and 2.70 MB of Water Solution Products or WATER accounting for 1.12%.
The revenue from sales and service provision in SAFETY products was 180.99 MB, decreasing by 42.30 MB or 18.94%, mainly due to a decrease in prices of rubber and nitrile gloves, coupled with lower purchase orders from distributors and medical sectors, compared with the same quarter in the last year. Meanwhile, the revenue from COVID-19 preventive equipment also dropped in relation to the intensity of the situation. However, SAFETY products in other categories are still generating a continuous increase in purchase orders both from existing customer bases and new customers in accordance with the expansion of the industrial sector.
The revenue from sales and service provision in CE products was 57.07 MB, has also dropped by 17.29 MB or 23.25% due to a decrease in market prices of rubber and nitrile gloves, compared with the same period of time in the last year when there was a product shortage caused by COVID-19, causing product prices to soar. Hence, key customers in the electronics industry including distributor customers have increased purchase orders to accumulate the inventory,
The revenue from sales and service provision in the WATER products was 2.70 MB, decreasing by 0.50 MB or 15.70% compare to the same quarter in the last year, mainly due to the impact of COVID-19, customers have decided to delay or cancel the water treatment projects.
Cost of Sales and Services
The Company’s total costs in quarter 2/2022 were 180.19 MB, comprising of 178.56 MB cost of sales and 1.62 MB cost of services. Cost of sales and services decreased proportionally with lower revenue from sales and services. In quarter 2/2022, costs of sales and services accounted for 74.84% of revenue from sales and service. The Company’s gross profit was 60.57 MB, decreased by 9.64 MB or 13.74% due to lower revenue from sales and services. However, gross profit margin was 25.16%, increase from the same quarter last year with a gross profit margin of 23.34% due to effectively cost management and the proportion of sales of products with high gross profit margins increased.
Distribution Costs and Administrative Expenses
In Quarter 2/2022, Distribution costs and administrative expenses were 46.29 MB comprised 21.51 MB of distribution costs, 22.53 MB of administrative expenses and 2.25 MB. Of loss on exchange rate. Distribution costs and administrative expenses were similar compared to the same quarter of the previous year which mainly increased transportation and traveling expenses in line with oil prices, meanwhile, the employee welfare and product donations expenses related to situation of the epidemic of COVID-19 decreased compared to the same quarter of the last year.
The company’s financial cost was 0.69 MB, increasing by 0.06 MB or 9.97% compared to financial cost of 0.62 MB in the same quarter of previous year.
Net profit
In Quarter 2/2022, the company’s consolidate net profit attributable to equity holders was 10.56 MB, accounted for net profit margin 4.38%, decreasing by 7.80 MB or 42.50% compared to net profit attributable to equity holders of 18.36 MB, accounted for net profit margin 6.10% in the same quarter of previous year.
Financial Position
Unit : MB
| June 30, 2022 | December 31, 2021 | Increased (Decreased) |
% Change | |||
|---|---|---|---|---|---|---|
| Amount | % | Amount | % | |||
| Current Assets | 480.69 | 73.11% | 461.67 | 72.56% | 19.02 | 4.12% |
| Non-Current Assets | 176.82 | 26.89% | 174.56 | 27.44% | 2.25 | 1.29% |
| Total Assets | 657.51 | 100.00% | 636.23 | 100.00% | 21.28 | 3.34 |
| Current Liabilities | 271.97 | 41.28% | 246.31 | 38.63% | 25.67 | 10.42% |
| Non-Current Liabilities | 42.16 | 6.40% | 41.76 | 6.55% | 0.41 | 0.97% |
| Total Liabilities | 314.14 | 47.68% | 288.06 | 45.18% | 26.07 | 9.05% |
| Shareholder's Equity of the Company | 344.67 | 52.32% | 349.47 | 54.82% | (4.80) | -1.37% |
Assets
As of June, 2022, the Company’s total assets were 657.51 MB, increasing by 21.28 MB or 3.34% from December 31, 2021. The assets increased mainly from current assets, which increasing from 21.39 MB of cash and cash equivalents and 10.54 MB of net-inventories. However, trade and other current receivables-net decreased 12.10 MB. Non-current assets mainly increased from investments in joint venture of 3.72 MB in the construction of solid waste management center project. However, property, plant and equipment-net mainly decreased from depreciation and amortization.
Liabilities
As of June, 2022, the Company’s total liabilities were 314.14 MB, increasing by 26.07 MB or 9.05% from December 31, 2021. The Liabilities increased mainly from current liabilities which increase from 42.94 MB of short-term loans from financial institutions to pay for goods and working capital. However, trade and other payables decreased by 12.54 MB, current portion of long-term loan from financial institution-net decreased by 2.96 MB and current income tax payable decreased by 1.56 MB.
Shareholder's equity
As of June 30, 2022, Shareholders’ equity of the Company was 344.67 MB, decreasing by 4.80 MB or 1.37% from December 31, 2021 from net profit for the period. The shareholders' equity increased from the net profit for the period of 27.67 MB and decreased from dividend payment of 32.39 MB.
Cash Flows
Unit : MB
| Cash Flows | June 30, 2022 | June 30, 2021 |
|---|---|---|
| Cashflow from (used in) operating activities | 21.34 | (25.52) |
| Cashflow from (used in) investing activities | (5.24) | (0.61) |
| Cashflow from (used in) financing activities | 5.36 | (5.48) |
| Net increase (decrease) in cash and cash equivalents | 21.46 | (31.61) |
| Cash and cash equivalents at the end of the period | 80.10 | 60.70 |
For the six month period, ending June 30, 2022, the Company’s net cash from the operating activities was 21.34 MB, with operating profits prior to changes in the operating assets and liabilities of 43.82 MB. Cash flow increased from trade and other receivables decreased 12.56 MB and nettrade and other payables decreased 13.47 MB. However, cash flow decreased from inventories increased 11.91 MB and paid for corporate income tax of 9.77 MB.
Cash flow used in investment activities was 5.24 MB to purchase fix assets of 2.27 MB, purchase intangible assets of 0.15 MB and investment in joint venture of 3.72 MB, while cash flow acquired 0.61 MB from loan to employees, 0.12 MB from sales fix assets and interest received of 0.19 MB.
Cash flow acquired from financing activities was 5.36 MB mainly from short-term loan from financial institutions amount of 42.93 MB, however, cash flow used to repayment of long-term loans from financial institutions of 3.57 MB, repayment of liabilities under lease agreement of 0.40 MB, interest expense of 1.22 MB and dividend payment of 32.38 MB.
Management Discussion & Analysis (MD&A) Quarter 1/2022
Overview
Referring to the operating performance in the consolidated statement of financial position in the first quarter, ending March 31, 2022, Phol Dhanya PCL (the Company)’s total revenue from sales and services were 276.54 MB, decreasing by 46.79 MB or 14.47% YoY at 323.32 MB. The decline in revenue is mainly from Occupational Safety, Health and Environment Products or ‘SAFETY’ and Control Environment Products or ‘CE’, due to a significant drop in market prices of rubber and nitrile gloves, together with an excessive supply, compared with the same period of time in the last year when there was a product shortage in the supply chain, causing prices to go up. Furthermore, the sales revenue from COVID-19-related products also decreased in accordance with the intensity of the spread. However, SAFETY and CE products used in the industrial sector are still securing a continuous increase in purchase orders in pursuit of the expansion of the manufacturing sector in key industries. The gross profit decreased in line with lower revenue from sales and services, in the first quarter of 2022, the company’s gross profit was 68.39 MB, representing gross profit margin of 24.73%.
Distribution costs and administrative expenses slightly increased, compared to the same quarter of the previous year. The Company’s net profit for the first quarter of 2022 was 17.11 MB; equivalent to 6.14%, decreasing by 9.72 MB or 36.22% YoY at 26.82 MB; equivalent to 8.28%.
Operating performance
Unit : MB
| Q1/2022 | Q1/2021 | Increased (Decreased) |
% YoY | |
|---|---|---|---|---|
| Revenue from sales | 270.29 | 315.50 | (45.21) | -14.33% |
| Revenue from services | 6.24 | 7.82 | (1.58) | -20.20% |
| Total Revenues | 276.54 | 323.32 | (46.79) | -14.47% |
| Cost of sales | (203.50) | (241.04) | (37.54) | -15.57% |
| Cost of services | (4.64) | (6.40) | (1.76) | -27.46% |
| Total Costs | (208.15) | (247.45) | (39.30) | -15.88% |
| Gross Profit | 68.39 | 75.88 | (7.49) | -9.87% |
| Gross Profit Margin (%) | 24.73% | 23.47% | ||
| Other income | 2.07 | 0.44 | 1.63 | 370.98% |
| Total Distribution costs and Administrative expenses | (48.39) | (46.63) | 1.76 | 3.76% |
| Profit before finance Costs and income taxes | 22.07 | 29.68 | (7.62) | -25.65% |
| Profit before finance Costs and income taxes (%) | 7.92% | 9.17% | ||
| Loss from impairment of trade and other receivables | 0.00 | 0.00 | 0.00 | n/a |
| Financial Cost | (0.58) | (0.53) | 0.05 | 8.83% |
| Reversal of impairment (Loss from impairment) on trade and other receivables-nets | (0.01) | 4.46 | 3.07 | |
| Income tax expenses | (4.37) | (6.78) | (2.41) | -35.53% |
| Profit attributable to equity holders | 17.11 | 26.82 | (9.72) | -36.22% |
| Net profit margin (%) | 6.14% | 8.28% | ||
| Basic earnings per share (Baht) | 0.08 | 0.13 | (0.05) | -36.22% |
Revenue
Unit : MB
| Q1/2022 | % | Q1/2021 | % | Increased | % | |
|---|---|---|---|---|---|---|
| Occupational Safety, Health and Environment Products (SAFETY) | 201.53 | 72.88% | 208.19 | 64.39% | (6.66) | -3.20% |
| Control Environment Products (CE) | 55.53 | 20.08% | 107.66 | 33.30% | (52.13) | -48.42% |
| Water Solution Products (WATER) | 19.48 | 7.04% | 7.48 | 2.31% | 12.00 | 160.55% |
| Total revenue from sales and services | 276.54 | 100% | 323.32 | 100% | (46.79) | -14.47% |
The total revenue from sales and service provision in the first quarter of 2022 were 276.54 MB, with 201.53 MB of Occupational Safety, Health and Environment Products or SAFETY accounting for 72.88%, 55.53 MB of Control Environment Products or CE accounting for 20.28 % and 19.48 MB of Water Solution Products or WATER accounting for 7.04%.
The revenue from sales and service provision in SAFETY products was 201.53 MB, decreasing by 6.66 MB or 3.20%, mainly due to a decrease in prices of rubber and nitrile gloves, coupled with lower purchase orders from distributors, compared with the same quarter in the last year. Meanwhile, the revenue from COVID-19 preventive equipment also dropped in relation to the intensity of the situation. However, SAFETY products in other categories are still generating a continuous increase in purchase orders both from existing customer bases and new customers in accordance with the expansion of the industrial sector.
The revenue from sales and service provision in CE products was 55.53 MB, has also dropped by 52.13 MB or 48.42% due to a decrease in market prices of rubber and nitrile gloves, compared with the same period of time in the last year when there was a product shortage caused by COVID-19, causing product prices to soar. Hence, key customers in the electronics industry have increased purchase orders to accumulate the inventory, while there has been an increase in customers in the distributor market. There was a decline in purchase orders in the first quarter of 2022, while an oversupply of gloves still remains prevalent.
The revenue from sales and service provision in the WATER products was 19.48 MB, increasing by 12 MB or 160.55% compare to the same quarter in the last year, mainly due to sales of equipment for waste landfill construction, in collaboration with a business partner. However, due to the impact of COVID-19, customers have decided to delay or cancel the water treatment projects.
Distribution Costs and Administrative Expenses
In Quarter 1/2022, Distribution costs and administrative expenses were 48.39 MB comprised 25.59 MB of distribution costs and 22.80 MB of administrative expenses. Distribution costs mainly increased from employee compensation and transportation expenses, however, administrative expenses were similar compared to the same quarter of the last year
The company’s financial cost was 0.58 MB, increasing by 0.05 MB or 8.83% compared to financial cost of 0.53 MB in the same quarter of previous year.
Other Transaction
In Quarter 1/2022, the Company had loss from impairment on trade and other receivables-nets of 0.01 MB, while, reversed the impairment of trade receivables and other receivables of 4.46 MB in the same quarter of previous year, its comes from the operation of offsetting creditors, retention payments due to the debtor of sub-contractor, which the company has reserved the loss on impairment of receivables.
Net profit
In Quarter 1/2022, the company’s consolidate net profit attributable to equity holders was 17.11 MB, accounted for net profit margin 6.14%, decreasing by 9.72 MB or 36.22% compared to net profit attributable to equity holders of 26.82 MB, accounted for net profit margin 8.28% in the same quarter of previous year.
Financial Position
Unit : MB
| March 31, 2022 | March 31, 2021 | Increased (Decreased) |
% Change | |||
|---|---|---|---|---|---|---|
| Amount | % | Amount | % | |||
| Current Assets | 484.49 | 73.45% | 461.67 | 72.56% | 22.82 | 4.94% |
| Non-Current Assets | 175.15 | 26.55% | 174.56 | 27.44% | 0.59 | 0.34% |
| Total Assets | 659.64 | 100.00% | 636.23 | 100.00% | 23.41 | 3.68% |
| Current Liabilities | 252.71 | 38.31% | 246.31 | 38.63% | 6.41 | 2.60% |
| Non-Current Liabilities | 41.65 | 6.31% | 41.76 | 6.55% | (0.11) | -0.26% |
| Total Liabilities | 294.36 | 44.62% | 288.06 | 45.18% | 6.30 | 2.19% |
| Shareholder's Equity of the Company | 366.58 | 55.57% | 349.47 | 54.82% | 17.11 | 4.90% |
Assets
As of March 31, 2022, the Company’s total assets were 659.64 MB, increasing by 23.41 MB or 3.68% from December 31, 2021. The assets increased mainly from current assets, which increasing from 19.13 MB of trade and other current receivables-net, most of which were receivables that had not yet been due and cash and cash equivalents increased by 9.37 MB. However, net-inventories decreased by 4.83 MB. Non-current assets mainly increased from investments in joint venture of 1.09 MB in the construction of solid waste management center project.
Liabilities
As of March 31, 2022, the Company’s total liabilities were 294.36 MB, increasing by 6.30 MB or 2.19% from December 31, 2021. The Liabilities increased mainly from the increase of 34.84 MB of short-term loans from financial institutions to pay for goods and working capital. However, trade and other payables decreased by 31.18 MB.
Shareholder's equity
As of March 31, 2022, Shareholders’ equity of the Company was 366.58 MB, increasing by 17.11 MB or 4.90% from December 31, 2021 from net profit for the period.
Cash Flows
Unit : MB
| Cash Flows | March 31, 2022 | March 31, 2021 |
|---|---|---|
| Cashflow from (used in) operating activities | (22.35) | (16.46) |
| Cashflow from (used in) investing activities | (0.59) | (0.21) |
| Cashflow from (used in) financing activities | 32.31 | (4.88) |
| Net increase (decrease) in cash and cash equivalents | 9.37 | (21.55) |
| Cash and cash equivalents at the end of the period | 68.09 | 70.79 |
For the three month period, ending March 31, 2022, the Company’s net cash used in the operating activities was 22.35 MB, with operating profits prior to changes in the operating assets and liabilities of 22.90 MB. Cash flow decreased from trade and other receivables increased 18.60 MB and net- trade and other payables decreased 32.98 MB. While, cash flow received from inventories decreased 6.58 MB
Cash flow used in investment activities was 0.59 MB to purchase fix assets of 0.21 MB and investment in joint venture of 1.09 MB, while cash flow acquired 0.49 MB from loan to employees, 0.12 MB from sales fix assets and interest received of 0.11 MB.
Cash flow acquired from financing activities was 32.31 MB mainly from short-term loan from financial institutions amount of 34.84 MB, however, cash flow used to repayment of long-term loans from financial institutions of 1.79 MB, repayment of liabilities under lease agreement of 0.20 MB and interest expense of 0.55 MB.
Management Discussion & Analysis (MD&A) Yearly 2021
Overview
Referring to the operating performance in the consolidated financial statement for the year, ending December 31, 2021, Phol Dhanya PCL (the Company)’s total revenue from sales and services were 1,225.76 MB, increasing by 170.25 MB or 16.13% YoY at 1,055.51 MB. Occupational Safety, health and personal protective equipment as well as control environment products with increase continuous purchase orders from major industrial customers such as electronics industry, foods industry and automotive industries that have expanded their production capacity compared to the previous year. And the situation of the epidemic of COVID-19, there is still the demand for disease prevention items continuously, both for the industrial and medical sectors, leading to increase the revenues from hospital, medical and public health organizations, including more dealer customers. In addition, revenue increased due to the price increased of nitrile gloves, rubber gloves, which significant at the beginning of this year, however, gloves normally do not secure high gross margin, despite higher sales. Meanwhile, sales of products with higher gross margin has decreased, leading to lower average gross margin compared to the last year. In 2021, the Company’s gross profit margin was 287.59 MB, or equivalent to 23.46%, the gross profit increased 13.45 MB or 4.91% compare with gross profit of 274.14 MB or equivalent to 25.97% in previous year and selling and administrative expenses slightly increased from the previous year.
As the result, the Company’s net profit attributable to equity holders of 81.89 MB, equivalent to 6.66%, increasing by 8.03 MB or 10.87% compare to net profit attributable to equity holders of 73.86 MB, equivalent to 6.94% in the previous year.
Operating performance
Unit : MB
| Y2021 | Y2020 | Increased (Decreased) |
% YoY | |
|---|---|---|---|---|
| Revenue from sales | 1,203.45 | 1,019.23 | 184.22 | 18.07% |
| Revenue from services | 22.31 | 36.28 | (13.97) | -38.51% |
| Total Revenues | 1,225.76 | 1,055.51 | 170.25 | 16.13% |
| Cost of sales | (921.75) | (752.56) | 169.19 | 22.48% |
| Cost of services | (16.42) | (28.81) | (12.40) | -43.02% |
| Total Costs | (938.17) | (781.38) | 156.80 | 20.07% |
| Gross Profit | 287.59 | 274.14 | 13.45 | 4.91% |
| Gross Profit Margin (%) | 23.46% | 25.97% | ||
| Other income | 4.06 | 9.45 | (5.38) | -56.99% |
| Total Selling and Administrative Expenses | (191.77) | (190.05) | 1.72 | 0.90% |
| Profit before finance Costs and income taxes | 99.89 | 93.54 | 6.35 | 6.79% |
| Profit before finance Costs and income taxes (%) | 8.12% | 8.78% | ||
| Loss from impairment of trade and other receivables | (0.70) | 0.00 | 0.70 | n/a |
| Financial Cost | (2.76) | (2.41) | 0.36 | 14.76% |
| Reversal of impairment of trade and other receivables | 5.81 | 0.00 | 5.81 | n/a |
| Income tax expenses | (20.34) | (17.27) | 3.07 | 17.78% |
| Profit attributable to equity holders | 81.89 | 73.86 | 8.03 | 10.87% |
| Net profit margin (%) | 6.66% | 6.94% | ||
| Basic earnings per share (Baht) | 0.40 | 0.36 | 0.04 | 10.87% |
Revenue
Unit : MB
| Y2021 | % | Y2020 | % | Increased | % | |
|---|---|---|---|---|---|---|
| Occupational Safety, Health and Environment Products (SAFETY) | 889.88 | 72.60% | 800.40 | 75.83% | 89.48 | 11.18% |
| Control Environment Products (CE) | 305.75 | 24.94% | 214.93 | 20.36% | 90.82 | 42.26% |
| Water Solution Products (WATER) | 30.13 | 2.46% | 40.18 | 3.81% | (10.05) | -25.02% |
| Total revenue from sales and services | 1,225.76 | 100% | 1,055.51 | 100% | 170.25 | 16.13% |
In 2021, the total revenue from sales and services provision were 1,225.76 MB, with 889.88 MB of Occupational Safety, Health and Environment Products or SAFETY accounting for 72.60%, 305.75 MB of Control Environment Products or CE accounting for 24.94% and 30.13 MB of Water Solution Products or WATER accounting for 2.46%.
The revenue from sales and service provisions from SAFETY products was 889.88 MB, increasing by 89.48 MB or 11.18%, mainly from existing customers and new customers in the foods industry and electronics industry that have continue expanded their production capacity and other major industries, such as automotive, petrochemicals, have increased production compared to the previous year. And the situation of the epidemic of COVID-19, there is still the demand for disease prevention items continuously, leading to increased revenues from hospital, medical and public health organizations and more dealer customers, in addition, there was an increase in the revenue from consumer through online sales channels.
The revenue from sales and service provision in CE products was 305.75 MB, increasing by 90.82 MB or 42.26% mainly from key customers in the electronics industry that have continued expanded their production capacity, leading to higher demand for CE products. In addition, product prices have increased in pursuit of the higher market prices at the beginning of the year especially higher demand for clean room gloves and disposable gloves amidst COVID-19 has led to an increase in revenue for CE products both from existing and new customers.
The revenue from sales and service provision in WATER Products was 30.13 MB, decreasing by 10.05 MB or 25.02%, mainly from the installation of water supply system and continue providing services for existing customers, including after-sales services and maintenance. However, the COVID-19 situation has caused certain customers’ new projects to delay.
Other income
In 2021, the Company had other income 4.06 MB, decreasing by 5.38 MB or 56.99% compare to other income of 9.45 MB from previous year mainly due to the refund of penalties from the water supply projects.
Cost of Sales and Services
In 2021, the Company’s total costs was 938.17 MB, comprising of 921.75 MB cost of sales and 16.42 MB cost of services. Cost of sales increased proportionally with more revenue from sales and increased cost of goods in some product categories and from exchange rates. Cost of services decreased in line with lower sales of services compared to the previous year.
Costs of sales and services accounted for 76.54% of revenue from sales and service. Gross profit was 287.59 MB with gross profit margin 23.46%, gross profit increased 13.45 MB or 4.91% proportionally with more revenue from sales compare to gross profit of 274.14 MB with gross profit margin 25.97% in the previous year. However, the gross profit margin declined, due to increased cost of goods in some categories and the sales proportion of products with lower gross profit margins increased while the proportion of sales of products with higher gross profit margin decreased.
Selling and Administrative Expenses
In 2021, selling and administrative expenses were 191.77 MB comprised 92.61 MB of selling expenses, 96.51 MB of administrative expenses and 2.64 MB of loss from exchange rates. Selling expenses increased mainly from variable with revenue from sales, such as sales commissions, transportation expense, etc. and more promotional advertising expenses to expand consumer and online marketing. However, administrative expenses declined due to lower travelling and activities expenses due to the COVID-19 situation and reduced from employee benefit expenses.
The company’s financial cost was 2.76 MB, increasing by 0.36 MB or 14.76% compared to financial cost of 2.41 MB in the previous year due to the increase in short term loan from financial institution.
Other Transaction
The reversal of impairment loss on trade and other receivables of 5.81 MB and loss arising from bad debts of trade and other receivable of 0.70 MB, resulting from the operation of offsetting creditors, retention payments due to the debtor of sub-contractor, which the company has reserved the loss on impairment of receivables and the trial is over.
Net profit
In 2021, the company’s consolidate net profit attributable to equity holders was 81.89 MB, accounted for net profit margin 6.66%, net profit increase of 8.03 MB or 10.87% compared to net profit of 73.86 MB, accounted for net profit margin 6.94% in the previous year.
Financial Position
Unit : MB
| December 31, 2021 | December 31, 2020 | Increased (Decreased) |
% Change | |||
|---|---|---|---|---|---|---|
| Amount | % | Amount | % | |||
| Current Assets | 461.67 | 72.56% | 428.90 | 70.78% | 32.76 | 7.64% |
| Non-Current Assets | 174.56 | 27.44% | 177.10 | 29.22% | (2.53) | -1.43% |
| Total Assets | 636.23 | 100.00% | 606.00 | 100.00% | 30.23 | 4.99% |
| Current Liabilities | 246.31 | 38.63% | 231.44 | 38.11% | 14.86 | 6.42% |
| Non-Current Liabilities | 41.76 | 6.55% | 47.41 | 7.81% | (5.65) | -11.91% |
| Total Liabilities | 288.06 | 45.18% | 278.85 | 45.92% | 9.22 | 3.30% |
| Shareholder's Equity of the Company | 349.47 | 54.82% | 328.45 | 54.08% | 21.01 | 6.40% |
Assets
As of December 31, 2021, the Company’s total assets were 636.23 MB, increasing by 30.23 MB or 4.99% from December 31, 2020. The assets increased mainly from current assets, which increased from 66.66 MB of net-inventories, while, cash and cash equivalents decreased by 33.67 MB. And non-current assets decreased mainly from depreciation and amortization.
Liabilities
As of December 31, 2021, the Company’s total liabilities were 288.06 MB, increasing by 9.22 MB or 3.31% from December 31, 2020. The Liabilities increased mainly from the increase of 7.13 MB of short-term loans-trust receipt from financial institutions, 9.14 MB of trade payables and 3.65 MB of accrued income tax. However, other payables decreased 5.29 MB. Non-current liabilities decreased mainly from 5.36 MB of long-term loans from financial institutions and 0.29 MB of lease liabilities-net while the provision for employee benefit liabilities increasing by 1.65 MB.
Shareholder's equity
As of December 31, 2021, Shareholders’ equity of the Company was 349.47 MB, increasing by 21.01 MB or 6.40% from December 31, 2020 from the resulting from net profit of 81.89 MB, while, decreasing by 60.75 MB from dividend payment and allocated as a legal reserve of 3.96 MB.
Cash Flows
Unit : MB
| Cash Flows | December 31, 2021 | December 31, 2020 |
|---|---|---|
| Cashflow from (used in) operating activities | 35.31 | 79.93 |
| Cashflow from (used in) investing activities | (4.64) | (5.10) |
| Cashflow from (used in) financing activities | (64.22) | (68.01) |
| Net increase (decrease) in cash and cash equivalents | (33.55) | 6.82 |
| Cash and cash equivalents at the end of the period | 58.71 | 92.39 |
The Company’s net cash from the operating activities was 35.31 MB, with operating profits prior to changes in the operating assets and liabilities of 116.38 MB. Cash flow received from trade and other receivables decreased 5.50 MB and net- trade and other payables increased 3.81 MB. While, cash flow used for 72.42 MB of inventories 72.42 MB, 1.31 MB to paid employee benefits and 17.19 MB of income tax.
Cash flow used in investment activities was 4.64 MB to purchase 0.77 MB of equipment, 1.94 MB to improved public utilities and 1.93 MB of assets under water sales agreement and purchased 0.49 MB of intangible assets, while cash flow acquired 0.23 MB from loan to employees and interest received of 0.37 MB.
Cash flow used in financing activities was 64.22 MB mainly used to repayment of loans from financial institutions 7.14 MB, repayment of liabilities under lease agreement 0.80 MB, interest expense 2.67 MB and dividend payment of 60.74 MB. However, cash flow acquired 7.13 MB from short-term loans-trust receipt from financial institutions.
Management Discussion & Analysis (MD&A) Quarter 3/2021
Overview
Referring to the operating performance in the consolidated financial statement in the third quarter, ending September 30, 2021, Phol Dhanya PCL (the Company)’s total revenue from sales and services were 329.67 MB, increasing by 58.80 MB or 21.71% YoY at 270.87 MB. Occupational Safety, health and personal protective equipment as well as control environment products with increase continuous purchase orders from electronics industry and foods industry that have continue expanded their production capacity and other major industries, such as automotive, petrochemicals, have increased production compared to the same quarter of previous year. In addition, the situation of the epidemic of COVID-19, there is still the demand for disease prevention items continuously, both for the industrial and medical sectors, leading to increase the revenues from hospital, medical and public health organizations, including more dealer customers. In the third quarter of 2021, the gross profit margin standing at 75.48 MB, or equivalent to 22.90%, the gross profit increased in line with the increase in sales revenue and selling and administrative expenses did not differ much from the same quarter of previous year as the result the Company’s net profit for the third quarter of 2021 was 23.70 MB; equivalent to 7.17%, increasing by 11.58 MB or 95.59% compared to net profit attributable to equity holders of 12.12 MB; equivalent to 4.47% in the same quarter of previous year.
For the nine month period, ending September 30, 2021, the Company’s total revenue from sales and services were 953.84 MB, increasing by 164.15 MB or 20.79%, compared to the revenue from sales and services of 789.69 MB in the same period of previous year. The Company’s net profit for the nine months period of 2021 was 68.89 MB; equivalent to 7.21%, increasing by 8.04 MB or 13.22% compared to net profit attributable to equity holders of 60.84 MB; equivalent to 7.66% in the same period of previous year.
Operating performance
Unit : MB
| Q3/2021 | Q3/2020 | Increased (Decreased) |
% Changed | 9M/2021 | 9M/2020 | Increased (Decreased) |
% Changed | |
|---|---|---|---|---|---|---|---|---|
| Revenue from sales | 324.09 | 252.03 | 72.06 | 28.59% | 937.78 | 760.89 | 176.88 | 23.25% |
| Revenue from services | 5.58 | 18.84 | (13.26) | -70.38% | 16.06 | 28.79 | (12.74) | -44.23% |
| Total Revenue | 329.67 | 270.87 | 58.80 | 21.71% | 953.84 | 789.69 | 164.15 | 20.79% |
| Cost of sales | (250.15) | (194.41) | 55.74 | 28.67% | (720.05) | (555.23) | 164.82 | 29.69% |
| Cost of services | (4.03) | (15.64) | (11.60) | -74.20% | (12.22) | (22.40) | (10.18) | -45.45% |
| Total Costs | (254.19) | (210.05) | 44.14 | 21.01% | (732.27) | (577.63) | 154.64 | 26.77% |
| Gross Profit | 75.48 | 60.82 | 14.66 | 24.11% | 221.57 | 212.06 | 9.51 | 4.48% |
| Gross Profit Margin(%) | 22.90% | 22.45% | 23.23% | 26.85% | ||||
| Other Income | 0.92 | 0.13 | 0.79 | 628.96% | 1.58 | 4.79 | (3.21) | -66.94% |
| Total Selling and Administrative Expenses | (45.95) | (46.06) | (0.11) | -0.24% | (139.30) | (140.09) | (0.80) | -0.57% |
| Profit before finance Costs and income taxes | 30.45 | 14.88 | 15.57 | 104.63% | 83.86 | 76.76 | 7.09 | 9.24% |
| Profit before Finance Costs and Income Taxes (%) | 9.21% | 5.49% | 8.78% | 9.66% | ||||
| Loss from impairment of trade and other receivables | 0.00 | 0.00 | 0.00 | n/a | (0.70) | 0.00 | 0.70 | n/a |
| Financial Cost | (0.86) | (0.68) | 0.19 | 27.47% | (2.02) | (1.81) | 0.21 | 11.77% |
| Reversal of impairment of trade and other receivables | 0.02 | 0.00 | 0.02 | n/a | 5.17 | 0.00 | 5.17 | n/a |
| Income tax expenses | (5.90) | (2.09) | 3.81 | 182.90% | (17.42) | (14.11) | 3.31 | 23.44% |
| Profit attributable to equity holders | 23.70 | 12.12 | 11.58 | 95.59% | 68.89 | 60.84 | 8.04 | 13.22% |
| Net profit margin (%) | 7.17% | 4.47% | 7.21% | 7.66% | ||||
| Basic earnings per share (Baht) | 0.12 | 0.06 | 0.06 | 95.59% | 0.34 | 0.30 | 0.04 | 13.22% |
Revenue
Unit : MB
| Revenue structure | Q3/2021 | % | Q3/2020 | % | Increased (Decreased) |
% Changed | M9/2021 | % | M9/2020 | % | Increased (Decreased) |
% Changed |
|---|---|---|---|---|---|---|---|---|---|---|---|---|
| Occupational Safety, Health and Environment Products (SAFETY) | 249.64 | 75.72% | 191.12 | 70.56% | 58.52 | 30.62% | 681.12 | 71.41% | 590.54 | 74.78% | 90.57 | 15.34% |
| Control Environment Products (CE) | 69.50 | 21.08% | 53.42 | 19.72% | 16.08 | 30.10% | 251.51 | 26.37% | 159.65 | 20.22% | 91.86 | 57.54% |
| Water Solution Products (WATER) | 10.53 | 3.19% | 26.33 | 9.72% | (15.80) | -60.01% | 21.21 | 2.22% | 39.50 | 5.00% | (18.29) | -46.30% |
| Total revenue from sales and services | 329.67 | 100% | 270.87 | 100% | 58.80 | 21.71% | 953.84 | 100% | 789.69 | 100% | 164.15 | 20.79% |
The total revenue from sales and services provision in the third quarter of 2021 were 329.67 MB, with 249.64 MB of Occupational Safety, Health and Environment Products or SAFETY accounting for 75.72%, 69.50 MB of Control Environment Products or CE accounting for 21.08% and 10.53 MB of Water Solution Products or WATER accounting for 3.19%.
The revenue from sales and service provisions from SAFETY products was 249.64 MB, increasing by 58.52 MB or 30.62%, mainly from existing customers and new customers in the foods industry and electronics industry that have continue expanded their production capacity and other major industries, such as automotive, petrochemicals, have increased production compared to the same quarter of previous year. Moreover, the situation of the epidemic of COVID-19, there is still the demand for disease prevention items continuously, leading to increased revenues from hospital, medical and public health organizations and more dealer customers, in addition, there was an increase in the revenue from consumer through online sales channels.
The revenue from sales and service provision in CE products was 69.50 MB, increasing by 16.08 MB or 30.10% mainly from customers in the electronics industry that have continued expanded their production capacity and expanded by hiring subcontractors to produce, that’s the opportunity for the company to expand sales to their subcontractors, leading to increased revenues from both existing customers and new customers
The revenue from sales and service provision in WATER Products was 10.53 MB, decreasing by 15.80 MB or 60.01% mainly due to the COVID-19 situation has caused certain customers’ new projects to delay.
Cost of Sales and Services
The Company’s total costs in the third quarter of 2021 was 254.19 MB, comprising of 250.15 MB cost of sales and 4.03 MB cost of services. Cost of sales increased proportionally with more revenue from sales and increased cost of goods in some product categories and from exchange rates. Cost of services decreased in line with lower sales of services compared to the same quarter of the previous year.
In the third quarter of 2021, costs of sales and services accounted for 77.10% of revenue from sales and service. Gross profit was 75.48 MB with gross profit margin 22.90%, gross profit increased 14.66 MB or 24.11% proportionally with more revenue from sales compare to gross profit of 60.82 MB with gross profit margin 22.45% in the same quarter of pervious year.
Selling and Administrative Expenses
In the third quarter of 2021, selling and administrative expenses were 45.95 MB comprised 22.35 MB of selling expenses, 22.30 MB of administrative expenses and 1.30 MB of loss from exchange rates. Total selling and administrative expenses were similar compared to 46.06 MB of selling and administrative expenses in the same quarter of previous year. Mainly from expenses that were variable with revenue from sales and services, such as sales commissions, etc. However, there was the decrease in expenses mainly from lower travelling and expenses for marketing activities and events due to the spread of the COVID-19 virus.
The company’s financial cost was 0.86 MB, increasing by 0.19 MB or 27.47% compared to financial cost of 0.68 MB in the same quarter of previous year due to the increase in short term loan from financial institution.
Net profit
In the third quarter of 2021, the company’s consolidate net profit attributable to equity holders was 23.70 MB, accounted for net profit margin 7.17%, an increase of 11.58 MB or 95.59% compared to the same quarter of the previous year with a net profit of 12.12 MB, accounted for net profit margin 4.47%
Financial Position
Unit : MB
| September 30, 2021 | December 31, 2020 | Increased (Decreased) |
% Change | |||
|---|---|---|---|---|---|---|
| Amount | % | Amount | % | |||
| Current Assets | 497.25 | 74.16% | 428.90 | 70.78% | 68.34 | 15.93% |
| Non Current Assets | 173.28 | 25.84% | 177.10 | 29.22% | (3.82) | -2.16% |
| Total Assets | 670.53 | 100.00% | 606.00 | 100.00% | 64.53 | 10.65% |
| Current Liabilities | 291.03 | 43.32% | 231.44 | 38.11% | 59.59 | 25.75% |
| Non Current Liabilities | 44.36 | 6.60% | 47.41 | 7.81% | (3.05) | -6.43% |
| Total Liabilities | 335.39 | 49.92% | 278.85 | 45.92% | 56.54 | 20.27% |
| Shareholder's Equity of the Company | 336.45 | 50.08% | 328.45 | 54.08% | 7.99 | 2.43% |
Assets
As of September 30, 2021, the Company’s total assets were 670.53 MB, increasing by 64.53 MB or 10.65% from December 31, 2020. The assets increased mainly from current assets, which increased from 70.49 MB of net-inventories, 43.06 MB of trade receivables-net from higher sales revenue. While, cash and cash equivalents decreased by 43.26 MB. And non-current assets decreased mainly from depreciation and amortization.
Liabilities
As of September 30, 2021, the Company’s total liabilities were 335.39 MB, increasing by 56.54 MB or 20.27% from December 31, 2020. The Liabilities increased mainly from the increase of 49.85 MB of overdraft and short-term loans from financial institutions, 22.05 MB of trade payables and 0.94 MB of accrued income tax. However, other payables decreased 13.58 MB. Non-current liabilities decreased mainly from 5.36 MB of long-term loans from financial institutions and 0.48 MB of lease liabilities-net while the provision for employee benefit liabilities increasing by 2.22 MB.
Shareholder's equity
As of September 30, 2021, Shareholders’ equity of the Company was 336.45 MB, increasing by 7.99 MB or 2.43% from December 31, 2020 from the resulting from net profit of 68.89 MB, while, decreasing by 60.75 MB from dividend payment.
Cash Flows
Unit : MB
| Cash Flows | September 30, 2021 | September 30, 2020 |
|---|---|---|
| Cashflow from (used in) operating activities | (23.16) | 37.48 |
| Cashflow from (used in) investing activities | (1.17) | (4.94) |
| Cashflow from (used in) financing activities | (18.78) | (52.36) |
| Net increase (decrease) in cash and cash equivalents | (43.11) | (19.83) |
| Cash and cash equivalents at the end of the period | 49.13 | 65.72 |
The Company’s net cash used in the operating activities was 23.16 MB, with operating profits prior to changes in the operating assets and liabilities of 96.97 MB. Cash flow used for trade and other receivables increased 35.23 MB and inventories increased 74.19 MB, while cash flow received from net- trade and other payables increased 6.33 MB.
Cash flow used in investment activities was 1.17 MB to purchase 1.73 MB of fix assets and 0.49 MB of intangible assets, while cash flow acquired 0.78 MB from loan to employees and interest received of 0.28 MB.
Cash flow used in financing activities was 18.78 MB mainly used to repayment of loans from financial institutions of 5.36 MB, repayment of liabilities under lease agreement of 0.60 MB, interest expense of 1.94 MB and dividend payment of 60.74 MB. However, cash flow acquired 49.85 MB from overdraft and short-term loans-trust receipt from financial institutions.
Management Discussion & Analysis (MD&A) Quarter 2/2021
Overview
Referring to the operating performance in the consolidated financial statement in the second quarter, ending June 30, 2021, Phol Dhanya PCL (the Company)’s total revenue from sales and service provision stood at 300.85 MB, increasing by 55.37 MB or 22.56% YoY at 245.47 MB. Occupational Safety, health and personal protective equipment as well as control environment products with continuous purchase orders from electronics industry and foods industry that have continue expanded their production capacity and core customers in automotive have increased production compared to the same quarter of previous year. In addition, the situation of the epidemic of COVID-19, there is still the demand for disease prevention items continuously, leading to increase the revenues from hospital, medical and public health organizations, especially gloves that have high demand both for the industrial and medical sectors. However, gloves normally do not secure high gross margin, despite higher sales, leading to lower average gross margin compared to the same time last year. The gross profit margin in the second quarter of 2021 standing at 70.21 MB, or equivalent to 23.34%. Selling and administrative expenses did not differ much from the same quarter of previous year. The Company’s net profit for the second quarter of 2021 stood at 18.36 MB; equivalent to 6.10%.
For the six months period, ending June 30, 2021, the Company’s total revenue from sales and service provision stood at 624.17 MB, increasing by 105.35 MB or 20.30%, compared to the revenue from sales and services of 518.82 MB in the same period of previous year. The Company’s net profit for the six months period of 2021 stood at 45.19 MB; equivalent to 7.23%.
Operating performance
Unit: Million baht
| Q2/2021 | Q2/2020 | Increased (Decreased) |
% Change | |
|---|---|---|---|---|
| Revenue from sales | 298.19 | 242.98 | 55.21 | 22.72% |
| Revenue from services | 2.65 | 2.49 | 0.17 | 6.68% |
| Total Revenues | 300.85 | 245.47 | 55.37 | 22.56% |
| Cost of sales | (228.85) | (182.65) | 50.69 | 28.45% |
| Cost of services | (1.78) | (1.83) | (0.04) | -2.40% |
| Total Costs | (230.63) | (179.99) | 50.65 | 28.14% |
| Gross Profit | 70.21 | 65.49 | 4.73 | 7.22% |
| Gross Profit Margin (%) | 23.34% | 26.68% | ||
| Other income | 0.44 | 3.79 | (3.35) | -88.41% |
| Total Selling and Administrative Expenses | (46.71) | (45.41) | 1.30 | 2.86% |
| Profit before finance Costs and income taxes | 23.73 | 23.43 | 0.30 | 1.27% |
| Profit before finance Costs and income taxes (%) | 7.88% | 9.42% | ||
| Loss from impairment of trade and other receivables | (0.70) | 0.00 | 0.70 | n/a |
| Financial Cost | (0.62) | (0.49) | 0.13 | 27.29% |
| Reversal of impairment of trade and other receivables | 0.70 | 0.00 | 0.70 | n/a |
| Income tax expenses | (4.74) | (4.58) | 0.16 | 3.53% |
| Profit attributable to equity holders | 18.36 | 18.37 | (0.00) | -0.01% |
| Net profit margin (%) | 6.10% | 7.38% | ||
| Basic earnings per share (Baht) | 0 .09 | 0.09 | (0.00) | -0.01% |
Revenue
Unit: Million baht
| Revenue Structure | Q2/2021 | % | Q2/2020 | % | Increased (Decreased) |
% Change |
|---|---|---|---|---|---|---|
| Occupational Safety, Health and Environment Products (SAFETY) | 223.29 | 74.22% | 185.60 | 75.61% | 37.69 | 20.31% |
| Control Environment Products (CE) | 74.36 | 24.72% | 52.99 | 21.59% | 21.36 | 40.31% |
| Water Solution Products (WATER) | 3.20 | 1.06% | 6.88 | 2.80% | (3.68) | -53.46% |
| Total revenue from sales and services | 300.85 | 100% | 245.47 | 100% | 55.37 | 22.56% |
The total revenue from sales and service provision in the second quarter of 2021 stood at 300.85 MB, with 223.29 MB of Occupational Safety, Health and Environment Products or SAFETY accounting for 74.22%, 74.36 MB of Control Environment Products or CE accounting for 24.72% and 3.20 MB of Water Solution Products or WATER accounting for 1.06%.
The revenue from sales and service provisions from SAFETY products stood at 223.29 MB, increasing by 37.69 MB or 20.31%, mainly from existing customers and new customers in the foods industry and electronics industry that have continue expanded their production capacity and core customers in automotive have increased production compared to the same quarter of previous year. In addition, the situation of the epidemic of COVID-19, there is still the demand for disease prevention items continuously, leading to increased revenues from hospital, medical and public health organizations.
The revenue from sales and service provision in CE products stood at 74.36 MB, increasing by 21.36 MB or 40.31% mainly from customers in the electronics industry that have continued expanded their production capacity and expanded by hiring subcontractors to produce, that’s the opportunity for the company to expand sales to their subcontractors, leading to increased revenues from both existing customers and new customers
The revenue from sales and service provision in WATER Products stood at 3.20 MB, decreasing by 3.68 MB or 53.46% mainly due to the COVID-19 situation has caused certain customers’ new projects to delay.
Cost of Sales and Services
The Company’s total costs in the second quarter of 2021 stood at 230.63 MB, comprising of 228.85 MB cost of sales and 1.78 MB cost of services. Cost of sales increased proportionally with more revenue from sales and cost of sales in some product categories increased. The cost of services was similar compared to the same quarter of the previous year.
In the second quarter of 2021, costs of sales and services accounted for 76.66% of revenue from sales and service. Gross profit was 70.21 MB with gross profit margin 23.34%, increased proportionally with more revenue from sales compare to gross profit of 65.49 MB with gross profit margin 26.68% in the same quarter of pervious year. However, gross profit margin decreased due to the proportion of sales of products with lower gross profit margins increased while the proportion of sales of products with higher gross profit margin decreased/p>
Selling and Administrative Expenses
In the second quarter of 2021, selling and administrative expenses were 46.71 MB comprised 21.71 MB of selling expenses, 24.28 MB of administrative expenses and 0.72 MB of loss from exchange rates. Total selling and administrative expenses increasing by 1.30 MB or 2.86% compare to the same quarter of previous year mainly from expenses that were variable with revenue from sales and services, such as sales commissions, etc. However, there was the decrease in expenses mainly from lower travelling and expenses for marketing activities and events due to the spread of the COVID-19 virus.
The company’s financial cost was 0.62 MB, increasing by 0.13 MB or 27.29% compared to financial cost of 0.49 MB in the same quarter of previous year due to the increase in short term loan from financial institution.
Other Transaction
In the second quarter of 2021, the Company recorded Loss arising from bad debt of trade and other receivables of 0.70 MB and reversed the impairment of trade receivables and other receivables of 0.70 MB, its comes from the operation of offsetting creditors, retention payments due to the debtor of sub-contractor, which the company has reserved the loss on impairment of receivables.
Net profit
In the second quarter of 2021, the company’s consolidate net profit attributable to equity holders was 18.36 MB, accounted for net profit margin 6.10%, similar with the net profit of 18.37 MB, accounted for net profit margin 7.38% in the same quarter of the previous year
Financial Position
Unit: Million baht
| June 30, 2021 | December 31, 2020 | Increased (Decreased) |
% Change | |||
|---|---|---|---|---|---|---|
| Amount | % | Amount | % | |||
| Current Assets | 501.65 | 74.23% | 428.90 | 70.78% | 72.75 | 16.96% |
| Non-Current Assets | 174.20 | 25.77% | 177.10 | 29.22% | (2.90) | -1.64% |
| Total Assets | 675.85 | 100.00% | 606.00 | 100.00% | 69.85 | 11.53% |
| Current Liabilities | 286.28 | 42.28% | 231.44 | 38.11% | 54.84 | 23.69% |
| Non-Current Liabilities | 45.65 | 6.74% | 47.41 | 7.81% | (1.75) | -3.70% |
| Total Liabilities | 331.94 | 49.02% | 278.85 | 45.92% | 53.09 | 19.04% |
| Shareholder's Equity of the Company | 345.22 | 50.98% | 328.45 | 54.08% | 16.76 | 5.10% |
Assets
As of June 30, 2021, the Company’s total assets were 675.85 MB, increasing by 69.85 MB or 11.53% from December 31, 2020. The assets increased mainly from current assets, which increased from 83.46 MB of net-inventories, 26.63 MB of trade receivables-net from higher sales revenue. While, cash and cash equivalents decreased by 31.68 MB. And non-current assets decreased mainly from depreciation and amortization.
Liabilities
As of June 30, 2021, the Company’s total liabilities were 331.94 MB, increasing by 53.09 MB or 19.04% from December 31, 2020. The Liabilities increased mainly from the increase of 27.94 MB of short-term loans from financial institutions, 43.74 MB of trade payables and 5.14 MB of accrued income tax. However, other payables decreased 22.23 MB. Non-current liabilities decreased mainly from 3.57 MB of long-term loans from financial institutions and 0.66 MB of lease liabilities-net while the provision for employee benefit liabilities increasing by 1.48 MB.
Shareholder's equity
As of June 30, 2021, Shareholders’ equity of the Company was 345.22 MB, increasing by 16.76 MB or 5.10% from December 31, 2020 from the resulting from net profit of 45.19 MB, while, decreasing by 28.35 MB from dividend payment.
Cash Flows
Unit: Million Baht
| Cash Flows | June 30, 2021 | June 30, 2020 |
|---|---|---|
| Cash flow from (used in) operating activities | (25.52) | 53.67 |
| Cash flow from (used in) investing activities | (0.61) | (3.57) |
| Cash flow from (used in) financing activities | (5.47) | (11.31) |
| Net increase (decrease) in cash and cash equivalents | (31.61) | 38.79 |
| Cash and cash equivalents at the end of the period | 60.70 | 124.35 |
The Company’s net cash used in the operating activities was 25.52 MB, with operating profits prior to changes in the operating assets and liabilities of 61.26 MB. Cash flow used for trade and other receivables increased 16.22 MB and inventories increased 83.76 MB, while cash flow received from net- trade and other payables increased 19.35 MB.
Cash flow used in investment activities was 0.61 MB to purchase fix assets and intangible assets of 1.47 MB, while cash flow acquired 0.65 MB from loan to employees and interest received of 0.20 MB.
Cash flow used in financing activities was 5.47 MB mainly used to repayment of loans from financial institutions of 3.57 MB, repayment of liabilities under lease agreement of 0.40 MB, interest expense of 1.11 MB and dividend payment of 28.34 MB. However, cash flow acquired 27.94 MB from short-term loans-trust receipt from financial institutions.
Management Discussion & Analysis (MD&A) Quarter 1/2021
Overview
Referring to the operating performance in the consolidated statement of financial position in the first quarter, ending March 31, 2021, Phol Dhanya PCL (the Company)'s total revenue from sales and service provision stood at 323.32 MB, increasing by 49.97 MB or 18.28% YoY at 273.35 MB, and increasing by 57.50 MB or 21.63% QoQ at 265.83MB. Safety, occupational health and personal protective equipment as well as control environment products are still top-selling items with continuous purchase orders from the COVID-19 situation, especially gloves that have high demand both for the industrial and medical sectors. The effective supply chain management system has contributed to the increase in revenue both from existing customer base and new customers. However, gloves normally do not secure high gross margin, despite higher sales. Meanwhile, sales of products with higher gross margin has decreased, leading to lower average gross margin compared to the same time last year. The gross margin was not much different from the previous quarter, with the gross margin in the first quarter of 2021 standing at 75.88 MB, or equivalent to 23.47%.
Selling and administrative expenses decreased YoY and did not differ much from the previous quarter. The Company's net profit for the first quarter of 2021 stood at 26.82 MB; equivalent to 8.28%, decreasing by 3.54 MB or 11.65% YoY at 30.36 MB; equivalent to 10.96%. However, the net profit increased by 13.81 MB or 106.10% QoQ at 13.01; equivalent to 4.86 %.
Operating performance
Unit: Million baht
| Q1/2021 | Q1/2020 | Increased (Decreased) |
% Change | |
|---|---|---|---|---|
| Revenue from sales | 315.50 | 265.89 | 49.61 | 18.66% |
| Revenue from services | 7.82 | 7.46 | 0.36 | 4.82% |
| Total Revenues | 323.32 | 273.35 | 49.97 | 18.28% |
| Cost of sales | (241.04) | (182.65) | 58.39 | 31.97% |
| Cost of services | (6.40) | (4.93) | 1.47 | 29.75% |
| Total Costs | (247.45) | (187.59) | 59.86 | 31.91% |
| Gross Profit | 75.88 | 85.76 | (9.89) | -11.53% |
| Gross Profit Margin (%) | 23.47% | 31.37% | ||
| Other income | 0.44 | 3.79 | (3.35) | -88.41% |
| Total Selling and Administrative Expenses | (46.63) | (51.09) | (4.46) | -8.73% |
| Profit before finance Costs and income taxes | 29.68 | 38.45 | (8.77) | -22.81% |
| Profit before finance Costs and income taxes (%) | 9.17% | 13.88% | ||
| Financial Cost | (0.53) | (0.64) | (0.11) | -16.65% |
| Reversal of impairment of trade and other receivables | 4.46 | 0.00 | 4.46 | |
| Income tax expenses | (6.78) | (7.45) | (0.67) | -8.98% |
| Profit attributable to equity holders | 26.82 | 30.36 | (3.54) | -11.65% |
| Net profit margin (%) | 8.28% | 10.96% | ||
| Basic earnings per share (Baht) | 0.13 | 0.15 | (0.02) | -11.65% |
Revenue
Unit: Million baht
| Revenue Structure | Q1/2021 | % | Q1/2020 | % | Increased (Decreased) |
% Change |
|---|---|---|---|---|---|---|
| Occupational Safety, Health and Environment Products (SAFETY) | 208.19 | 64.39% | 213.82 | 78.22% | (5.63) | -2.63% |
| Control Environment Products (CE) | 107.66 | 33.30% | 53.24 | 19.48% | 54.42 | 102.20% |
| Water Solution Products (WATER) | 7.48 | 2.31% | 6.29 | 2.30% | 1.19 | 18.95% |
| Total revenue from sales and services | 323.32 | 100% | 273.35 | 100% | 49.97 | 18.28% |
The total revenue from sales and service provision in the first quarter of 2021 stood at 323.32 MB, with 208.19 MB of Occupational Safety, Health and Environment Products or SAFETY accounting for 64.39%, 107.66 MB of Control Environment Products or CE accounting for 33.30 % and 7.48 MB of Water Solution Product or WATER accounting for 2.31%.
The revenue from sales and service provisions from SAFETY business stood at 208.19 MB, from increased revenue from industrial customers. Existing customers in the core industries such as automotive and petrochemicals have started to resume production, though not to the point where it used to be pre-COVID-19. Furthermore, the Company generated higher revenue from new customers in the food industry, medical and public health organizations. Nevertheless, the overall revenue landscape in the SAFETY business decreased from COVID-related products, disease prevention items such as face masks and preventive gears that have had lower sales following market demand and price compared to the same time in 2020, which was the beginning period of the transmission, leading to increased demand in every sector.
The revenue from sales and service provision in CE business stood at 107.66 MB, mainly from customers in the electronics industry that have expanded their production capacity, leading to higher demand for CE products, while product prices have increased in pursuit of the higher market prices. Besides, higher demand for clean room gloves and disposable gloves amidst COVID-19 has led to an increase in revenue for CE products both from existing and new customers, compared to the same time in 2020 and the previous quarter.
The revenue from sales and service provision in WATER business stood at 7.48 MB, from the installation of water supply system for existing customers who have allowed the Company to continue providing services, as well as from after-sales services and maintenance. However, the COVID-19 situation has caused certain customers' new projects to delay.
Cost of Sales and Services
The Company's total costs in Quarter 1/2021 were 247.45 MB, comprising of 241.04 MB cost of sales and 6.40 MB cost of services. Cost of sales and services increased proportionally with more revenue from sales and services and cost of sales in some product categories increased.
In quarter 1/2021, costs of sales and services accounted for 76.53% of revenue from sales and service. Gross profit was 75.88 MB with gross profit margin 23.47%, decreased from gross profit of 85.76 MB with gross profit margin 31.37% in the same quarter of previous year, due to the proportion of sales of products with lower gross profit margins increased while the proportion of sales of products with higher gross profit margin decreased. However, gross profit increased 13.80 MB or 22.23% compared to the previous quarter with a gross profit of 203.75 MB with Gross profit margin 23.35%.
Selling and Administrative Expenses
In Quarter 1/2021, selling and administrative expenses were 46.43 MB comprised 22.58 MB of selling expenses, 22.59 MB of administrative expenses and 1.46 MB of loss from exchange rates. Total selling and administrative expenses decreased by 4.46 MB or 8.73% compare to the same quarter of previous year mainly from lower travelling expenses and expenses for marketing activities and events due to the spread of the COVID-19 virus. However, there was the increase in expenses that were variable with revenue from sales and services, such as sales commissions, etc.
The company's financial cost was 0.53 MB, decreasing by 0.11 MB or 16.65% compared to financial cost of 0.64 MB in the same quarter of previous year and decreasing by 0.07 MB or 10.93% compared to the previous quarter due to the decrease in loan from financial institution.
Other Transaction
In Quarter 1/2021, the Company reversed the impairment of trade receivables and other receivables of 4.46 MB, its comes from the operation of offsetting creditors, retention payments due to the debtor of sub-contractor, which the company has reserved the loss on impairment of receivables.
Net profit
In Quarter 1/2021, the company's consolidate net profit attributable to equity holders was 26.82 MB, accounted for net profit margin 8.28%, decreasing by 3.54 MB or 11.65% compared to net profit attributable to equity holders of 30.36 MB, accounted for net profit margin 10.96% in the same quarter of previous year. However, net profit increasing by 13.81 MB or 106.10% compared to net profit attributable to equity holders of 13.81 MB, accounted for net profit margin 4.86% in the previous quarter.
Financial Position
Unit: Million baht
| March 31, 2021 | December 31, 2020 | Increased (Decreased) |
% Change | |||
|---|---|---|---|---|---|---|
| Amount | % | Amount | % | |||
| Current Assets | 474.64 | 73.00% | 428.90 | 70.78% | 45.73 | 10.66% |
| Non-Current Assets | 175.53 | 27.00% | 177.10 | 29.22% | (1.57) | -0.88% |
| Total Assets | 650.17 | 100.00% | 606.00 | 100.00% | 44.17 | 7.29% |
| Current Liabilities | 249.30 | 38.27% | 231.44 | 38.11% | 17.85 | 7.71% |
| Non-Current Liabilities | 46.95 | 7.21% | 47.41 | 7.81% | (0.46) | -0.97% |
| Total Liabilities | 296.24 | 45.47% | 278.85 | 45.92% | 17.39 | 6.24% |
| Shareholder's Equity of the Company | 355.23 | 54.53% | 328.45 | 54.08% | 26.77 | 8.15% |
Assets
As of March 31, 2021, the Company's total assets were 650.17 MB, increasing by 44.17 MB or 7.29% from December 31, 2020. The assets increased mainly from current assets, which increasing from 30.02 MB of trade and other current receivables-net, trade accounts receivable increased from higher sales revenue and other receivables increased mainly from advance payments for inventories. And net-inventories increasing by 38.07 MB due to purchases of inventory in the first quarter of 2021 While, cash and cash equivalents decreased by 21.59 MB.
Liabilities
As of March 31, 2021, the Company's total liabilities were 296.24 MB, increasing by 17.39 MB or 6.24% from December 31, 2020. The Liabilities increased mainly from the increase of 38.67 MB of trade payables and 5.93 MB of accrued income tax. However, other payables decreased 24.59 MB. Non-current liabilities decreased mainly from 1.79 MB of long-term loans from financial institutions and 0.84 MB of lease liabilities-net while the provision for employee benefit liabilities increasing by 0.74 MB.
Shareholder's equity
As of March 31, 2021, Shareholders' equity of the Company was 355.23 MB, increasing by 26.77 MB or 8.15% from December 31, 2020 from net profit for the period.
Cash Flows
Unit: Million Baht
| Cash Flows | December 31, 2021 | December 31, 2020 |
|---|---|---|
| Cash flow from (used in) operating activities | -16.46 |
20.55 |
| Cash flow from (used in) investing activities | -0.21 |
-1.58 |
| Cash flow from (used in) financing activities | -4.88 |
-26.69 |
| Net increase (decrease) in cash and cash equivalents | -21.54 |
-7.71 |
| Cash and cash equivalents at the end of the period | 70.79 |
77.82 |
The Company's net cash used in the operating activities was 16.46 MB, with operating profits prior to changes in the operating assets and liabilities of 34.98 MB. Cash flow used for trade and other receivables increased 24.45 MB and inventories increased 38.31 MB, while cash flow received from net- trade and other payables increased 11.76 MB.
Cash flow used in investment activities was 0.21 MB to purchase fix assets and intangible assets of 0.66 MB, while cash flow acquired 0.35 MB from loan to employees and interest received of 0.10 MB.
Cash flow used in financing activities was 4.88 MB mainly used to repayment of loans from financial institutions of 4.17 MB, repayment of liabilities under lease agreement of 0.20 MB and interest expense of 0.51 MB.
Management Discussion & Analysis (MD&A) Yearly 2020
Overview
Phol Dhanya Public Company Limited (the Company) consolidated financial statement of the year, ending December 31, 202 0 reported the revenue from sales and services of 1 ,055.51 MB, comprise 1,019.23 MB of revenue from sales and 36.28 MB of revenue from services. Revenue from sales and services increased by 143.66 MB or 15.76%, compared to the revenue from sales and services of 911.85 MB in the previous year mainly due to the increase of revenue from sales of Occupational safety, health and personal protective equipment due to the spread of the COVID-19 virus including latex gloves and nitrile gloves, protection suits and protection masks which is still need to use the product continuously. Revenue from services were increase mainly from installation services of recycled water treatment systems for industrial customers. In 2020, the Company’s gross profit was 274.14 MB, accounted for gross profit margin of 25.97%, increasing by 38.14 MB or 16.16% compare with gross profit of 236 MB, accounted for gross profit margin of 25.88% in previous year. Selling and administrative expenses were similar compared to the previous year, as the result, the Company’s net profit attributable to equity holders of 73.86 MB, accounted for net profit margin of 6.94%, increasing by 32.44 MB or 7 8 . 3 2% compare to net profit attributable to equity holders of 41.42 MB, accounted for net profit margin of 4.45% in the previous year.
Operating performance
Unit: Million baht
| 2020 | 2019 | Increased (Decreased) |
% Change | |
|---|---|---|---|---|
| Revenue from sales and services | 1,019.23 | 890.79 | 128.44 | 14.42% |
| Revenue from construction and service contracts | 36.28 | 21.06 | 15.23 | 72.32% |
| Total Revenue | 1,055.51 | 911.85 | 143.66 | 15.76% |
| Cost of sales and services | 752.56 | 657.30 | 95.26 | 14.49% |
| Cost of construction and service contracts | 28.81 | 18.54 | 10.27 | 55.38% |
| Total Costs | 781.38 | 675.85 | 105.53 | 15.61% |
| Gross Profit | 274.14 | 236.00 | 38.14 | 16.16% |
| Gross Profit Margin (%) | 25.97% | 25.88% | ||
| Other income | 9.45 | 18.59 | (9.14) | -49.17% |
| Total Selling and Administrative Expenses | 190.05 | 195.85 | (5.81) | -2.96% |
| Profit before finance Costs and income taxes | 93.54 | 58.74 | 34.80 | 59.25% |
| Profit before finance Costs and income taxes (%) | 8.78% | 6.31% | ||
| Financial Cost | 2.41 | 5.17 | (2.76) | -53.42% |
| Income tax expenses | 17.27 | 12.15 | 5.12 | 42.15% |
| Profit attributable to equity holders | 73.86 | 41.42 | 32.44 | 78.32% |
| Net profit margin (%) | 6.94% | 4.45% | ||
| Basic earnings per share (Baht) | 0.36 | 0.20 | 0.16 | 78.32% |
Revenue
Unit: Million baht
| Revenue Structure | 2020 | % | 2019 | % | Increased (Decreased) |
% Change |
|---|---|---|---|---|---|---|
| Occupational Safety, Health and Environment Products (SAFETY) | 800.40 | 75.83% | 719.42 | 78.90% | 80.99 | 11.26% |
| Control Environment Products (CE) | 214.93 | 20.36% | 167.96 | 18.42% | 46.97 | 27.97% |
| Water Solution Products (WATER) | 40.18 | 3.81% | 24.48 | 2.68% | 15.70 | 64.13% |
| Total revenue from sales and services | 1,055.51 | 100% | 911.85 | 100% | 143.66 | 15.75% |
In 2020, revenue by products of the Company comprise 800.40 MB of Occupational Safety, Health and Environment Products or SAFETY account for 75.83%, 214.93 MB of Control Environment Products or CE account for 20.36% and 40.18 MB of Water Solution Products or WATER account for 3.81%.
Revenue from SAFETY products increased by 80.99 MB or 11.26% compare to the previous year, mainly due to the increase of revenue from sales of products for the safety in the spread of the COVID-19 virus including latex gloves and nitrile gloves, protection suits and protection masks, etc. And the COVID-19 virus outbreak, resulting in continued demand for such products throughout the year 2020 with increased in dealer customers, Government and state enterprises and food industry customers who have been growing up. In addition, proportion of revenues from new customers in consumer group increase from previous year. However, in the situation of the COVID-19 epidemic, affected to industrial customers like Auto and Petrochemical which orders decrease in order based on production. Revenue from CE products increased 46.97 MB or 27.97%, major customers in the electronics industry increase production expansion, In addition, the product price has been increased according to the market price as a result, higher revenue from CE products. And revenue from Water Solution Products increased 15.70 MB or 64.13%, mainly due to revenue from sales and installation services of water treatment systems for industrial customers.
Cost of Sales and Services
The Company’s total costs in 2020 were 781.38 MB, comprising of 752.56 MB cost of sales, and 28.81 MB cost of services. Cost of sales and services increased proportionally with more revenue from sales and services. In 2020, costs of sales and services accounted for 74.03% of revenue from sales and service. The Company’s gross profit was 274.14 MB, accounted for gross profit margin 25.97% which increased, compare with 236 MB of gross profit, accounted for gross profit margin 25.88% in the previous year.
Selling and Administrative Expenses
In 2020, selling and administrative expenses were 190.05 MB comprised 88.02 MB of selling expenses and 102.02 MB of administrative expenses. Total selling and administrative expenses were decrease compare to the previous year mainly from expenses for marketing activities and events that suspended due to the spread of the COVID-1 virus and employee benefit expense decreased resulting from the change in related laws in the previous year. However, there was the increase in expenses that were variable with revenue from sales and services, such as sales commissions, etc.
The company’s financial cost was 2.41 MB, decreasing by 2.76 MB or 53.42% compared to financial cost of 5.17 MB in the previous year due to the decrease in loan from financial institution.
Net profit
In 2020, the company’s consolidate net profit attributable to equity holders was 73.86 MB, accounted for net profit margin 6.94%, increasing by 32.44 MB or 78.32% compared to net profit attributable to equity holders of 41.42 MB, accounted for net profit margin 4.45% in the previous year.
Financial Position
Unit: Million baht
| December 31, 2020 | December 31, 2019 | Increased (Decreased) |
% Change | |||
|---|---|---|---|---|---|---|
| Amount | % | Amount | % | |||
| Current Assets | 428.90 | 7 0.78% | 387.59 | 68.34% | 41.32 | 10.66% |
| Non-Current Assets | 177.10 | 29.22% | 179.56 | 31.66% | (2.46) | -1.37% |
| Total Assets | 606.00 | 100.00% | 567.15 | 100.00% | 38.85 | 6.85% |
| Current Liabilities | 231.44 | 38.11% | 213.39 | 37.54% | 18.06 | 8.46% |
| Non-Current Liabilities | 47.41 | 7.81% | 52.77 | 9.28% | (5.37) | -10.17% |
| Total Liabilities | 278.85 | 45.92% | 266.16 | 46.82% | 12.69 | 4.77% |
| Shareholder's Equity of the Company | 328.45 | 54.08% | 302.29 | 53.18% | 26.16 | 8.66% |
Assets
As of December 31, 2020, the Company’s total assets were 606 MB, increased by 38.85 MB or 6.85% from December 31, 2019. The assets increased mainly from current assets, which increasing from 6.63 MB of cash and cash equivalents, trade receivables-net increased by 25.71 MB in line with higher revenue from sales. In addition, other receivables increased from an increase in advance payments for inventories by 7.02 MB and an increase in refundable import duty of 1.16 MB and increase of 1.72 MB in net-inventories. However, non-current assets mainly decreased from amortization and depreciation.
Liabilities
As of December 31, 2020, the Company’s total liabilities were 278.85 MB, increased by 1 2 . 6 9 MB or 4.77% from December 31, 2019. Current Liabilities increased mainly due to the increase of 25.33 MB of trade and other payables, while short-term loans from financial institution was decrease 7.43 MB and accrued income tax decreased 0.62 MB. Non-current liabilities decreased mainly from 7.14 MB of long-term loans from financial institutions, however, net-liabilities under lease agreement increased 1.31 MB.
Shareholder’s equity
As of December 31, 2020, Shareholders’ equity of the Company was 328.45 MB, increased from the resulting from net profit of 73.86 MB and decreased by 50.63 MB from dividend payment.
Cash Flows
Unit: Million Baht
| Cash Flows | December 31, 2020 | December 31, 2019 |
|---|---|---|
| Cash flow from (used in) operating activities | 79.93 |
128.62 |
| Cash flow from (used in) investing activities | -5.10 |
7.11 |
| Cash flow from (used in) financing activities | -68.01 |
-107.22 |
| Net increase (decrease) in cash and cash equivalents | 6.82 |
28.51 |
| Cash and cash equivalents at the end of the period | 92.39 |
85.76 |
The Company’s net cash acquired from the operating activities was 79.93 MB, with operating profits prior to changes in the operating assets and liabilities of 111 MB and cash flow received from net- trade and other payables increased 25.51 MB. While, cash flow used for inventories 5.03 MB, trade and other receivables increased 33.10 MB and income tax of 18.94 MB.
Cash flow used in investment activities was 5.10 MB to purchase vehicles and equipment of 4.98 MB and purchase intangible assets of 0.71 MB, while, cash flow acquired from interest received of 0.47 MB.
Cash flow used in financing activities was 68.01 MB mainly used to repayment of loans from financial institutions of 14.56 MB, repayment of liabilities under lease agreement of 0.47 MB, interest expense of 2.34 MB and dividend payment of 50.63 MB.
Management Discussion & Analysis (MD&A) Quarter 3/2020
Overview
Phol Dhanya Public Company Limited (the Company) consolidated financial statement of the nine months period, ending September 30, 2020, reported the total revenue from sales and services of 789.69 MB, increasing by 100.35 MB or 14.56%, compared to the revenue from sales and services of 689.34 MB in the same period of previous year. The Company’s consolidate net profit attributable to equity holders of 60.84 MB, representing a net profit margin of 7.66%, increasing by 34.47 MB or 130.73% compared to net profit attributable to equity holders of 26.37 MB, accounted for net profit margin of 3.78% in the same period of previous year.
The Company consolidated financial statement of the third quarter, ending September 30, 2020 reported the total revenue from sales and services of 270.87 MB comprise 252.03 MB of revenue from sales and 18.84 MB of revenue from services. Revenue from sales and services increases by 43.29 MB or 19.02%, compared to the total revenue from sales and services of 227.58 MB in the same quarter of previous year mainly due to the increase of revenue from sales of Occupational safety, health and personal protective equipment due to the spread of the COVID-19 virus including latex gloves and nitrile gloves, protection suits which is still need to use the product continuously, however, the cost of such products has increased, causing the company to have a lower gross profit margin. Revenue from services were increase mainly from installation services of recycled water treatment systems. In quarter 3/2020, the Company’s gross profit was 60.82 MB, accounted for gross profit margin of 22.45%. Selling and administrative expenses were similar compared to the same quarter of the previous year, the Company’s net profit attributable to equity holders of 12.12 MB, accounted for net profit margin of 4.47%.
Operating performance
Unit : MB
| Q3/2020 | Q3/2019 | Increased (Decreased) |
% Changed | 9M/2020 | 9M/2019 | Increased (Decreased) |
% Changed | |
|---|---|---|---|---|---|---|---|---|
| Revenue from sales | 252.03 | 223.46 | 28.56 | 12.78% | 760.89 | 673.85 | 87.04 | 12.92% |
| Revenue from services | 18.84 | 4.12 | 14.73 | 357.72% | 28.79 | 15.49 | 13.31 | 85.91% |
| Total Revenue | 270.87 | 227.58 | 43.29 | 19.02% | 789.69 | 689.34 | 100.35 | 14.56% |
| Cost of sales | 194.41 | 163.64 | 30.77 | 18.81% | 555.23 | 497.73 | 57.49 | 11.55% |
| Cost of services | 15.64 | 3.30 | 12.34 | 373.51% | 22.40 | 13.56 | 8.84 | 65.14% |
| Total Costs | 210.05 | 166.94 | 43.11 | 25.82% | 577.63 | 511.30 | 66.33 | 12.97% |
| Gross Profit | 60.82 | 60.64 | 0.18 | 0.29% | 212.06 | 178.05 | 34.02 | 19.11% |
| Gross Profit Margin(%) | 22.45% | 26.65% | 26.85% | 25.83% | ||||
| Other Income | 0.13 | 2.10 | (1.97) | -94.00% | 4.79 | 8.05 | (3.26) | -40.49% |
| Total Selling and Administrative Expenses | 46.06 | 45.89 | 0.18 | 0.38% | 140.09 | 147.89 | (7.80) | -5.28% |
| Profit before Finance Costs and Income Taxes | 14.88 | 16.85 | (1.97) | -11.71% | 76.76 | 38.20 | 38.56 | 100.95% |
| Profit before Finance Costs and Income Taxes (%) | 5.49% | 7.34% | 9.66% | 5.48% | ||||
| Financial Cost | 0.68 | 1.22 | (0.55) | -44.76% | 1.81 | 4.04 | (2.24) | -55.32% |
| Income tax expenses | 2.09 | 3.50 | (1.42) | -40.47% | 14.11 | 7.79 | 6.33 | 81.23% |
| Profit attributable to equity holders | 12.12 | 12.12 | (0.01) | -0.06% | 60.84 | 26.37 | 34.47 | 130.73% |
| Net Profit Margin(%) | 4.47% | 5.28% | 7.66% | 3.78% | ||||
| Basic earnings per share (Baht) | 0.06 | 0.06 | (0.00) | -0.06% | 0.30 | 0.13 | 0.17 | 130.73% |
Revenue
Unit : MB
| Revenue structure | Q3/2020 | % | Q3/2019 | % | Increased (Decreased) |
% Changed | M9/2020 | % | M9/2019 | % | Increased (Decreased) |
% Changed |
|---|---|---|---|---|---|---|---|---|---|---|---|---|
| Occupational Safety, Health and Environment Products (SAFETY) | 191.12 | 70.56% | 174.37 | 76.62% | 16.75 | 9.60% | 590.54 | 74.78% | 541.11 | 78.50% | 49.44 | 9.14% |
| Control Environment Products (CE) | 53.42 | 19.72% | 42.28 | 18.58% | 11.14 | 26.35% | 159.65 | 20.22% | 124.20 | 18.02% | 35.45 | 28.55% |
| Water Solution Products (WATER) | 26.33 | 9.72% | 10.93 | 4.80% | 15.40 | 140.86% | 39.50 | 5.00% | 24.04 | 3.49% | 15.46 | 64.32% |
| Total revenue from sales and services | 270.87 | 100% | 227.58 | 100% | 43.29 | 19.02% | 789.69 | 100% | 689.34 | 100% | 100.35 | 14.56% |
In Quarter 3/2020, revenue by products of the Company comprise 191.12 MB of Occupational Safety, Health and Environment Products or SAFETY account for 70.56%, 53.42 MB of Control Environment Products or CE account for 19.72% and 26.33 MB of Water Solution Products or WATER account for 9.72%.
Revenue from SAFETY products increased 16.75 MB or 9.60% compare to the same quarter of previous year, mainly due to the increase of revenue from sales of products for the safety in the spread of the COVID-19 virus including latex gloves and nitrile gloves and protection suits with increased in dealer customers, Government and state enterprises and food industry customers who have been growing up. Revenue from CE products increased 11.14 MB or 26.35% compare to the same quarter of previous year, major customers in the electronics industry increase production expansion, as a result, more orders for CE products. And revenue from Water Solution Products increased 15.0 MB or 140.86%, mainly due to revenue from installation services of recycled water treatment systems project to a private customer valued approximately 12 MB.
Cost of Sales and Services
The Company’s total costs in Quarter 3/2020 were 210.05 MB, comprising of 194.41 MB cost of sales, and 15.64 MB cost of services. Cost of sales increased proportionally with more revenue from sales and cost of glove category increase due to the product shortage according the rising market demand. Cost of services increased proportionally with more revenue from services. In quarter 3/2020, costs of sales and services account for 77.55% of revenue from sales and service. Gross profit margin was 22.45% which decreased, compare with gross profit margin 26.65% in the same quarter of previous year. The Company’s gross profit was 60.82 MB, similar to gross profit of 60.64 MB in the same quarter of previous year.
Selling and Administrative Expenses
In Quarter 3/2020, selling and administrative expenses were 46.06 MB comprised 21.37 MB of selling expenses and 23.37 MB of administrative expenses and 1.32 MB of loss from exchange rate. Total selling and administrative expenses were decrease compare to the same quarter of previous year mainly from exhibitions and events that suspended due to the spread of the COVID-1 virus. However, in quarter 3/2019 there was the reversal of the loss of asset impairment of 1.74 MB due to the disposition of assets, as a result, total selling and administrative expenses were decreased.
The company’s financial cost was 0.68 MB, decreased by 0.55 MB or 44.76% compared to financial cost of 1.22 MB in the same quarter of previous year due to the decrease in loan from financial institution.
Net profit
In Quarter 3/2020, the company’s consolidate net profit attributable to equity holders was 12.12 MB, accounted for net profit margin 4.47%, similar to net profit attributable to equity holders of 12.12 MB, accounted for net profit margin 5.28% in the same quarter of previous year.
Financial Position
Unit : MB
| September 30, 2020 | December 31, 2019 | Increased (Decreased) |
% Change | |||
|---|---|---|---|---|---|---|
| Amount | % | Amount | % | |||
| Current Assets | 423.07 | 70.22% | 387.59 | 68.34% | 35.48 | 9.15% |
| Non Current Assets | 179.42 | 29.78% | 179.56 | 31.66% | (0.15) | -0.08% |
| Total Assets | 602.49 | 100.00% | 567.15 | 100.00% | 35.34 | 6.23% |
| Current Liabilities | 239.21 | 39.62% | 213.39 | 37.54% | 25.83 | 12.10% |
| Non Current Liabilities | 49.20 | 8.15% | 52.77 | 9.28% | (3.58) | -6.78% |
| Total Liabilities | 288.41 | 47.77% | 266.16 | 46.82% | 22.25 | 8.36% |
| Shareholder's Equity of the Company | 315.38 | 52.23% | 302.29 | 53.18% | 13.09 | 4.33% |
Assets
As of September 30, 2020, the Company’s total assets were 602.49 MB, increased by 35.34 MB or 6.23% from December 31, 2019. The assets increased mainly from current assets, which increasing from 33.48 MB of trade receivables-net, 22.39 MB of net-inventories. However, cash and cash equivalents decreased 20.04 MB.
Liabilities
As of September 30, 2020, the Company’s total liabilities were 288.41 MB, increased by 22.25 MB or 8.36% from December 31, 2019. Current Liabilities increased mainly due to the increase of 23.05 MB of trade and other payables, 5.63 of short-term loans from financial institution while accrued income tax decreased 2.98 MB. Non-current liabilities decreased mainly from 5.36 MB of long-term loans from financial institutions, however, net-liabilities under lease agreement increased 1.39 MB.
Shareholder's equity
As of September 30, 2020, Shareholders’ equity of the Company was 315.38 MB, increased from the resulting from net profit of 60.84 MB and decreased by 50.63 MB from dividend payment.
Cash Flows
Unit : MB
| Cash Flows | September 30, 2020 | September 30, 2019 |
|---|---|---|
| Cashflow from (used in) operating activities | 37.48 | 77.90 |
| Cashflow from (used in) investing activities | (4.94) | 0.82 |
| Cashflow from (used in) financing activities | (52.36) | (68.33) |
| Net increase (decrease) in cash and cash equivalents | (19.83) | 10.39 |
| Cash and cash equivalents at the end of the period | 65.72 | 67.67 |
The Company’s net cash acquired from the operating activities was 37.48 MB, with operating profits prior to changes in the operating assets and liabilities of 91.64 MB and cash flow received from net- trade and other payables increased 22.37 MB. While, cash flow used for inventories 25.83 MB and trade and other receivables increased 33.37 MB.
Cash flow used in investment activities was 4.94 MB to purchase vehicles and equipment of 4.51 MB and purchase intangible assets of 0.61 MB, while, cash flow acquired from interest received of 0.34 MB.
Cash flow used in financing activities was 52.36 MB mainly used to repayment of loans from financial institutions of 5.36 MB, repayment of liabilities under lease agreement of 0.28 MB, interest expense of 1.78 MB and dividend payment of 50.63 MB. However, cash flow acquired 5.68 MB from short-term loans-trust receipt from financial institutions.
Management Discussion & Analysis (MD&A) Quarter 2/2020
Overview
For the six months period, ending June 30, 2020, The Company’s revenue from sales and services totals 581.82 MB, increasing by 57.06 MB or 12.36%, compared to the revenue from sales and services of 461.76 MB in the same period of previous year. The Company’s consolidate net profit attributable to equity holders of 48.73 MB, representing a net profit margin of 9.82%, increasing by 34.48 MB or 242.04% compared to net profit attributable to equity holders of 14.25 MB, accounted for net profit margin of 3.05% in the same period of previous year.
Phol Dhanya Public Company Limited (the Company) consolidated financial statement of the second quarter, ending June 30, 2020 reported the total revenue from sales and services of 245.47 MB comprise 242.98 MB of revenue from sales and 2.49 MB of revenue from services. Revenue from sales and services increases by 23.68 MB or 10.68%, compared to the total revenue from sales and services of 221.79 MB in the same quarter of previous year mainly due to the increase of revenue from sales of Occupational safety, health, personal protective equipment and other related products due to the spread of the COVID-19 virus such as protection masks, protection suits, latex gloves and nitrile gloves , there is still need to use the product continuously. In quarter 2/2020, the Company’s gross profit was 65.49 MB, accounted for gross profit margin of 26.68%, increasing by 10.42 MB or 18.93% compared to a gross profit of 55.06 MB, accounted for gross profit margin of 24.83% in the same quarter of the previous year. In addition, selling and administrative expenses were decreases, as a result, the Company’s net profit attributable to equity holders of 18.37 MB, accounted for net profit margin of 7.38%, increasing by 16.63 MB or 958.82% compared to net profit attributable to equity holders of 1.73 MB, accounted for net profit margin of 0.77% in the same quarter of previous year.
Operating performance
Unit : MB
| Q2/2020 | Q2/2019 | Increased (Decreased) |
% Changed | 6M/2020 | 6M/2019 | Increased (Decreased) |
% Changed | |
|---|---|---|---|---|---|---|---|---|
| Revenue from sales | 242.98 | 213.98 | 29.01 | 13.56% | 508.87 | 450.39 | 58.48 | 12.98% |
| Revenue from services | 2.49 | 7.82 | (5.33) | -68.17% | 9.95 | 11.37 | (1.42) | -12.48% |
| Total Revenue | 245.47 | 221.79 | 23.68 | 10.68% | 518.82 | 461.76 | 57.06 | 12.36% |
| Cost of sales | 178.16 | 159.76 | 18.40 | 11.52% | 360.81 | 334.10 | 26.72 | 8.00% |
| Cost of services | 1.83 | 6.97 | (5.15) | -73.82% | 6.76 | 10.26 | (3.50) | -34.12% |
| Total Costs | 179.99 | 166.73 | 13.25 | 7.95% | 367.57 | 344.36 | 23.22 | 6.74% |
| Gross Profit | 65.49 | 55.06 | 10.42 | 18.93% | 151.25 | 117.41 | 33.84 | 28.83% |
| Gross Profit Margin(%) | 26.68% | 24.83% | 29.15% | 25.43% | ||||
| Other Income | 3.35 | 3.83 | (0.48) | -12.56% | 5.99 | 5.95 | 0.04 | 0.66% |
| Total Selling and Administrative Expenses | 45.41 | 55.19 | (9.78) | -17.72% | 95.35 | 102.00 | (6.65) | -6.52% |
| Profit before Finance Costs and Income Taxes | 23.43 | 3.71 | 19.72 | 532.15% | 61.88 | 21.35 | 40.54 | 189.88% |
| Profit before Finance Costs and Income Taxes (%) | 9.42% | 1.64% | 11.79% | 4.56% | ||||
| Financial Cost | 0.49 | 1.13 | (0.64) | -56.77% | 1.13 | 2.82 | (1.69) | -59.91% |
| Income tax expenses | 4.58 | 0.65 | 3.92 | 600.28% | 12.03 | 4.28 | 7.74 | 180.79% |
| Profit attributable to equity holders | 18.37 | 1.73 | 16.63 | 958.82% | 48.73 | 14.25 | 34.48 | 242.04% |
| Net Profit Margin(%) | 7.38% | 0.77% | 9.28% | 3.05% | ||||
| Basic earnings per share (Baht) | 0.09 | 0.01 | 0.08 | 958.82% | 0.24 | 0.07 | 0.17 | 242.04% |
Revenue
Unit : MB
| Revenue structure | Q2/2020 | % | Q2/2019 | % | Increased (Decreased) |
% Changed | M6/2020 | % | M6/2019 | % | Increased (Decreased) |
% Changed |
|---|---|---|---|---|---|---|---|---|---|---|---|---|
| Occupational Safety, Health and Environment Products (SAFETY) | 185.60 | 75.61% | 170.92 | 77.06% | 14.68 | 8.59% | 399.42 | 76.99% | 366.73 | 79.42% | 32.69 | 8.91% |
| Control Environment Products (CE) | 52.99 | 21.59% | 40.99 | 18.48% | 12.00 | 29.27% | 106.24 | 20.48% | 81.92 | 81.92% | 24.31 | 29.68% |
| Water Solution Products (WATER) | 6.88 | 2.80% | 9.88 | 4.46% | (3.00) | -30.37% | 13.17 | 2.54% | 13.11 | 2.84% | 0.06 | 0.47% |
| Total revenue from sales and services | 245.47 | 100% | 221.79 | 100% | 23.68 | 10.68% | 518.82 | 100% | 461.76 | 100% | 57.096 | 12.36% |
In Quarter 2/2020, revenue by products of the Company comprise 185.60 MB of Occupational Safety, Health and Environment Products or SAFETY account for 75.61%, 52.99 MB of Control Environment Products or CE account for 21.59% and 6.88 MB of Water Solution Products or WATER account for 2.80%.
Revenue from SAFETY products increased 14.68 MB or 8.59% and revenue from CE products increased 12 MB or 29.27% compare to the same quarter of previous year, mainly due to the increase of revenue from sales of products for the safety in the spread of the COVID-19 virus, especially personal protective equipment such as protection suits, gloves, protection masks, etc. Regarding to the epidemic of Virus COVID-19 shall be effected a constant demand for the aforementioned products according to new practices to prevent the spread of pathogens. However, revenue from Water Solution Products decrease 3 MB or 30.37%, because some customers have delayed their orders and temporarily stopped operating in accordance with government measures.
Cost of Sales and Services
The Company’s total costs in Quarter 2/2020 were 179.99 MB, comprising of 178.16 MB cost of sales, and 1.83 MB cost of services. Cost of sales increased proportionally with more revenue from sales and cost of services decreased in line with the lower revenue of services. In quarter 2/2020, costs of sales and services account for 73.32% of revenue from sales and service. Gross profit margin was 26.68% which increase, compare with gross profit margin 24.83% in the same quarter of previous year, due to the proportion of sales of products with high gross profit margins increased including increasing sales of new customers. As a result, the Company’s gross profit was 65.49 MB, increasing by 10.42 MB or 18.93% compared to gross profit of 55.06 MB in the same quarter of previous year.
Selling and Administrative Expenses
In Quarter 2/2020, selling and administrative expenses were 45.41 MB comprised 21.95 MB of selling expenses and 23.46 MB of administrative expenses. Total selling and administrative expenses decreased by 9.78 MB or 17.72% compare with selling and administrative expenses of 55.19 MB in the same quarter of previous year mainly from employee benefit expense.
The company’s financial cost was 0.49 MB, decreasing by 0.64 MB or 56.77% compared to financial cost of 1.13 MB in the same quarter of previous year due to the decrease in loan from financial institution.
Net profit
In Quarter 2/2020, the company’s consolidate net profit attributable to equity holders was 18.37 MB, accounted for net profit margin 7.38%, increasing by 16.63 MB or 958.82% compared to net profit attributable to equity holders of 1.73 MB, accounted for net profit margin 0.77% in the same quarter of previous year.
Financial Position
Unit : MB
| June 30, 2020 | December 31, 2019 | Increased (Decreased) |
% Change | |||
|---|---|---|---|---|---|---|
| Amount | % | Amount | % | |||
| Current Assets | 500.93 | 73.72% | 387.59 | 68.34% | 113.34 | 29.24% |
| Non Current Assets | 178.53 | 26.28% | 179.56 | 31.66% | (1.03) | -0.57% |
| Total Assets | 679.46 | 100.00% | 567.15 | 100.00% | 112.31 | 19.80% |
| Current Liabilities | 298.27 | 43.83% | 213.39 | 37.54% | 84.89 | 39.78% |
| Non Current Liabilities | 48.82 | 7.17% | 52.77 | 9.28% | (3.95) | -7.49% |
| Total Liabilities | 347.10 | 51.01% | 266.16 | 46.82% | 80.94 | 30.41% |
| Shareholder's Equity of the Company | 333.36 | 48.99% | 302.29 | 53.18% | 31.07 | 10.28% |
Assets
As of June 30, 2020, the Company’s total assets were 679.46 MB, increasing by 112.31 MB or 19.80% from December 31, 2019. The assets increased mainly from current assets, which increasing from 38.59 MB of cash and cash equivalents, 73.05 MB of net-inventories and 2.04 MB of trade and other current receivables-net.
Liabilities
As of June 30, 2020, the Company’s total liabilities were 347.10 MB, increasing by 80.94 MB or 30.41% from December 31, 2019. The Liabilities increased mainly due to the increase of 65.36 MB of trade and other payables, 5.92 MB of accrued income tax and 13.70 of short-term loans from financial institution. However, Non-current liabilities decreased mainly from 3.57 MB of long-term loans from financial institutions and 1.18 MB of provision for employee benefit liabilities.
Shareholder's equity
As of June 30, 2020, Shareholders’ equity of the Company was 333.36 MB, increased from the resulting from net profit of 48.73 MB, while, decreasing by 20.25 MB from dividend payment.
Cash Flows
Unit : MB
| Cash Flows | June 30, 2020 | June 30, 2019 |
|---|---|---|
| Cashflow from (used in) operating activities | 53.67 | 47.05 |
| Cashflow from (used in) investing activities | (3.57) | 0.36 |
| Cashflow from (used in) financing activities | (11.31) | (36.84) |
| Net increase (decrease) in cash and cash equivalents | 38.79 | 10.57 |
| Cash and cash equivalents at the end of the period | 124.35 | 68.10 |
The Company’s net cash acquired from the operating activities was 53.67 MB, with operating profits prior to changes in the operating assets and liabilities of 68.65 MB and cash flow received from net- trade and other payables increased 67.01 MB. While, cash flow used for inventories 73.33 MB and trade and other receivables increased 2.30 MB.
Cash flow used in investment activities was 3.57 MB to building improvement of 2.33 MB and purchase tools and equipment of 1.73 MB and purchase intangible assets of 0.25 MB, while, cash flow acquired from loan to employees of 0.43 MB and interest received of 0.25 MB.
Cash flow used in financing activities was 11.31 MB mainly used to repayment of loans from financial institutions of 3.57 MB, repayment of liabilities under lease agreement of 0.19 MB, interest expense of 1.10 MB and dividend payment of 20.25 MB. However, cash flow acquired 13.80 MB from short-term loans-trust receipt from financial institutions.
Management Discussion & Analysis (MD&A) Quarter 1/2020
Overview
Phol Dhanya Public Company Limited (the Company) consolidated financial statement of the first quarter, ending March 31, 2020 reported the total revenue from sales and services of 273.35 MB, increasing by 33.38 MB or 13.91%, compared to the total revenue from sales and services of 239.97 MB in the same quarter of previous year mainly due to the increase of revenue from sales of Occupational safety, health, personal protective equipment and other related products due to the spread of the COVID-19 virus, resulting in increased demand for such products in many customer groups. As a result, the Company’s gross profit was 85.76 MB, accounted for gross profit margin of 31.37% in quarter 1/2020, increasing by 23.43 MB or 37.56% compared to a gross profit of 62.34 MB, accounted for gross profit margin of 25.98% in the same quarter of the previous year. Selling and administrative expenses were 51.09 MB with variable expenses increased according to increase of revenue from sales and services
Operating performance
Unit: Million baht
| Q1/2020 | Q1/2019 | Increased (Decreased) |
% Change | |
|---|---|---|---|---|
| Revenue from sales and services | 273.20 | 239.86 | 33.34 | 13.90% |
| Revenue from construction and service contracts | 0.15 | 0.11 | 0.04 | 42.55% |
| Total Revenues | 273.35 | 239.97 | 33.38 | 13.91% |
| Cost of sales and services | 187.48 | 176.96 | 10.52 | 5.94% |
| Cost of construction and service contracts | 0.11 | 0.66 | (0.55) | -83.52% |
| Total Costs | 187.59 | 177.62 | 9.96 | 5.61% |
| Gross Profit | 85.76 | 62.34 | 23.42 | 37.56% |
| Gross Profit Margin (%) | 31.37% | 25.98% | ||
| Other income | 3.79 | 2.11 | 1.67 | 79.12% |
| Total Selling and Administrative Expenses | 51.09 | 46.81 | 4.28 | 9.14% |
| Profit before finance Costs and income taxes | 38.45 | 17.64 | 20.81 | 117.96% |
| Profit before finance Costs and income taxes (%) | 13.88% | 7.29% | ||
| Profit attributable to equity holders | 30.36 | 12.51 | 17.85 | 142.67% |
| Net profit margin (%) | 10.96% | 5.17% | ||
| Basic earnings per share (Baht) | 0.15 | 0.06 | 0.09 | 142.67% |
| Weighted average number of ordinary shares (million shares) | 202.50 | 202.50 |
Revenue
Unit: Million baht
| Revenue Structure | Q1/2020 | % | Q1/2019 | % | Increased (Decreased) |
% Change |
|---|---|---|---|---|---|---|
| Occupational Safety, Health and Environment Products (SAFETY) | 213.81 | 78.22% | 195.82 | 81.60% | 17.99 | 9.19% |
| Control Environment Products (CE) | 53.26 | 19.48% | 40.93 | 17.06% | 12.32 | 30.11% |
| Water Solution Products (WATER) | 6.29 | 2.30% | 3.22 | 1.34% | 3.06 | 95.13% |
| Total revenue from sales and services | 273.35 | 100% | 239.97 | 100% | 33.38 | 13.91% |
In Quarter 1/2020, the Company’s revenue from sales and services were 273.35 MB, comprise 265.89 MB of revenue from sales, 7.31 MB of revenue from services and 0.15 MB of revenue from construction contracts. Revenues from sales and services increasing by 33.38 MB or 13.91% compared to the total revenue from sales and services of 239.97 MB in the same quarter of previous year.
Revenue from Occupational Safety, Health and Environment Products or SAFETY was 213.81 MB, increasing by 17.99 MB or 9.19% and revenue from Control Environment Products or CE was 53.26 MB, increasing by 12.32 MB or 30.11% compared to the same quarter of previous year, Revenues from the SAFETY Products and CE Products were increases mainly due to the increase of revenue from sales of products for the safety in the spread of the COVID-19 virus, especially personal protective equipment such as protection suits, protection masks, gloves, etc. Furthermore, the Company also sourced other relevant products to sell; temperature measurement tools, disinfectants, and alcohol gel. Regarding to the epidemic of Virus COVID-19, the demand for the above mentioned products has increased in many customer groups, both in hospitals and public health groups, dealers, new customer needs such products to use and to donation for medical staff. In addition, partly of industrial customers required more orders to prevent product shortages. Revenue from Water Solution Products or WATER was 6.29 MB, increasing by 3.06 MB or 95.13% compared to the same quarter of previous year, due to the increase from sales and services in industrial project sector.
Cost of Sales and Services
The Company’s total costs in Quarter 1/2020 were 187.59 MB, comprising of 182.65 MB cost of sales, 4.83 MB cost of services and 0.11 MB cost of construction. Cost of sales and services increased proportionally with more revenue from sales and services.
In quarter 1/2020, costs of sales and services account for 68.63% of revenue from sales and service. Gross profit margin was 31.37% which increase, compare with Gross profit margin 25.98% in the same quarter of previous year, due to the proportion of sales of products with high gross profit margins increased including increasing sales of new customers as mentioned above. In Quarter 1/2020, the Company’s gross profit was 85.76 MB, increasing by 23.42 MB or 37.56% compared to gross profit of 62.34 MB in the same quarter of previous year.
Selling and Administrative Expenses
In Quarter 1/2020, selling and administrative expenses were 51.09 MB comprised 23.42 MB of selling expenses, 26.52 MB of administrative expenses and 1.15 of loss from exchange rates. Total selling and administrative expenses increased by 4.28 MB or 9.14% compare with selling and administrative expenses of 46.81 MB in the same quarter of previous year mainly from variable expenses which increased according to revenue from sales and services.
The company’s financial cost was 0.64 MB, decreasing by 0.86 MB or 57.29% compared to financial cost of 1.50 MB in the same quarter of previous year due to the decrease in loan from financial institution.
Net profit
In Quarter 1/2020, the company’s consolidate net profit attributable to equity holders was 30.36 MB, accounted for net profit margin 10.96%, increasing by 17.85 MB or 142.67% compared to net profit attributable to equity holders of 12.51 MB, accounted for net profit margin 3.49% in the same quarter of previous year.
Financial Position
Unit: Million baht
| March 31, 2020 | December 31, 2019 | Increased (Decreased) |
% Change | |||
|---|---|---|---|---|---|---|
| Amount | % | Amount | % | |||
| Current Assets | 428.11 | 70.54% | 387.59 | 68.34% | 40.52 | 10.46% |
| Non-Current Assets | 178.76 | 29.46% | 179.56 | 31.66% | (0.81) | -0.45% |
| Total Assets | 606.87 | 100.00% | 567.15 | 100.00% | 39.72 | 7.00% |
| Current Liabilities | 222.75 | 36.63% | 213.39 | 37.54% | 9.36 | 4.39% |
| Non-Current Liabilities | 49.94 | 8.21% | 52.77 | 9.28% | (2.84) | -5.38% |
| Total Liabilities | 272.69 | 44.84% | 266.16 | 46.82% | 6.53 | 2.45% |
| Shareholder's Equity of the Company | 335.48 | 55.16% | 302.29 | 53.18% | 33.19 | 10.98% |
Assets
As of March 31, 2020, the Company’s total assets were 606.87 MB, increasing by 39.72 MB or 7% from December 31, 2019. The assets increased mainly from current assets, which increasing from 49.97 MB of trade and other current receivables-net. While, cash and cash equivalents decreased by 7.94 MB and net-inventories decreased 1.36 MB.
Liabilities
As of March 31, 2020, the Company’s total liabilities were 272.69 MB, increasing by 6.53 MB or 2.45% from December 31, 2019. The Liabilities increased mainly due to the increase of 25.80 MB of trade and other payables, 7.73 MB of accrued income tax, however, short-term loans from financial institution decreased 24.16 MB. Non-current liabilities decreased mainly from 1.79 MB of long-term loans from financial institutions and 1.90 MB of provision for employee benefit liabilities.
Shareholder’s equity
As of March 31, 2020, Shareholders’ equity of the Company was 335.48 MB, increased from the resulting from net profit of 30.36 MB.
Cash Flows
Unit: Million Baht
| Cash Flows | March 31, 2020 | March 31, 2019 |
|---|---|---|
| Cash flow from (used in) operating activities | 20.55 | 9.62 |
| Cash flow from (used in) investing activities | (1.58) | 0.04 |
| Cash flow from (used in) financing activities | (26.69) | (26.06) |
| Net increase (decrease) in cash and cash equivalents | (7.71) | (16.40) |
| Cash and cash equivalents at the end of the period | 77.82 | 40.93 |
The Company’s net cash acquired from the operating activities was 20.55 MB, with operating profits prior to changes in the operating assets and liabilities of 43.48 MB and cash flow received from net-inventories decreased 1.05 MB and trade and other payables increased 25.82 MB. While, cash flow used for trade and other receivables increased 49.34 MB.
Cash flow used in investment activities was 1.58 MB to purchase fix assets and intangible assets of 1.69 MB, while, cash flow acquired from interest received of 0.12 MB.
Cash flow used in financing activities was 26.69 MB mainly used to repayment of loans from financial institutions of 25.94 MB and repayment of liabilities under lease agreement of 0.10 MB and interest expense of 0.64 MB.
Management Discussion & Analysis (MD&A) Yearly 2019
Overview
Phol Dhanya Public Company Limited (the Company) consolidated financial statement of the year, ending December 31, 2019 reported the revenue from sales and services of 911.85 MB decreasing by 12.60 MB or 1.36%, compared to the revenue from sales and services of 924.45 MB in the previous year. Revenue from sales and services were increasing, while, revenue from construction and service contracts were decrease because there have no new project of the community water supply. However, in 2019, the Company’s gross profit was 236 MB, accounted for gross profit margin of 25.88%, gross profit was increase by 8.39 MB or 3.68% compare with gross profit of 227.62 MB, accounted for gross profit margin of 24.62% in the previous year due to cost of sales has dropped following the Baht appreciation and cost overrun for the community water supply construction projects was decrease. In addition, selling and administrative expenses were decreases, as the results for the Company’s net profit attributable to equity holders of 41.42 MB, accounted for net profit margin of 4.49% in 2019, increasing by 4.91 MB or 13.44% compare with net profit attributable to equity holders of 36.51 MB, accounted for net profit margin of 3.91% in the previous year.
Operating performance
Unit: Million baht
| 2019 | 2018 | Increased (Decreased) |
% Change | |
|---|---|---|---|---|
| Revenue from sales and services | 911.74 | 907.57 | 4.18 | 0.46% |
| Revenue from construction and service contracts | 0.11 | 16.89 | (16.78) | -99.38% |
| Total Revenue | 911.85 | 924.45 | (12.60) | -1.36% |
| Cost of sales and services | 674.47 | 673.42 | 1.05 | 0.16% |
| Cost of construction and service contracts | 1.38 | 23.42 | (22.04) | -94.11% |
| Total Costs | 675.85 | 696.84 | (20.99) | -3.01% |
| Gross Profit | 236 | 227.62 | 8.39 | 3.68% |
| Gross Profit Margin (%) | 25.88% | 24.62% | ||
| Other income | 11.35 | 9.35 | 2 | 21.39% |
| Total Selling and Administrative Expenses | 188.61 | 190.06 | (1.45) | -0.76% |
| Profit before finance Costs and income taxes | 58.74 | 46.9 | 11.84 | 25.25% |
| Profit before finance Costs and income taxes (%) | 6.36% | 5.02% | ||
| Profit attributable to equity holders | 41.42 | 36.51 | 4.91 | 13.44% |
| Net profit margin (%) | 4.49% | 3.91% | ||
| Basic earnings per share (Baht) | 0.2 | 0.18 | 0.02 | 13.44% |
| Weighted average number of ordinary shares (million shares) | 202.5 | 202.5 |
Revenue
Unit: Million baht
| Revenue Structure | 2019 | % | 2018 | % | Increased (Decreased) |
% Change |
|---|---|---|---|---|---|---|
| Occupational Safety, Health and Environment Products (SAFETY) | 719.42 | 78.90% | 715.73 | 77.42% | 3.69 | 0.52% |
| Control Environment Products (CE) | 167.96 | 18.42% | 172.57 | 18.67% | (4.61) | -2.67% |
| Water Solution Products (WATER) | 24.48 | 2.68% | 36.15 | 3.91% | (11.67) | -32.28% |
| Total revenue from sales and services | 911.85 | 100% | 924.45 | 100% | (12.6) | -1.36% |
In 2019, the Company’s revenue from sales and services were 911.85 MB, comprise 890.79 MB of revenue from sales, 20.95 MB of revenue from services and 0.11 MB of revenue from construction and service contracts. Revenues from sales and services decreases by 12.60 MB or 1.36% compared to the previous year.
Revenue from Occupational Safety, Health and Environment Products or SAFETY was 719.42 MB, increasing by 3.69 MB or 0.52% compared to the previous year. Revenue from sales in government sector and new customers were increase, however, revenue from existing customers in some sectors were decrease such as petrochemical industry and automotive industry, due to competition situation and reduced budget for orders following reduction in production capacity as a result of economic slowdown and revenue from services decreased due to the nature of the project.
The revenue from Control Environment Products or CE was 167.96 MB, decreasing by 4.61 MB or 2.67% compared to the previous year, major customers are in the electronics industry reduce production capacity according to the slowing export market which affected by US-China trade war and global economic slowdown.
Revenue from Water Solution Products or WATER was 24.48 MB, decreasing by 11.67 MB or 32.28% compared to the previous year. Revenue from sales and services of water project in industrial customer sector were increase, however, revenue from construction and service contracts were decrease because there have been no new assignments of community water supply construction projects.
In 2019, the company’s other incomes of 11.35 MB, derived from gain on exchange rate of 6.50 MB and other incomes of 4.85 MB.
Cost of Sales and Services
In 2019, The Company’s total costs were 675.85 MB, comprising of 657.30 MB costs of sales, 17.17 MB cost of services and 1.38 MB cost of construction. Cost of sales increase proportionally with revenue from sales, however, cost of sales from some products had lower than previous year due to the Baht appreciation and cost of services decreased proportionally with less revenue from services. Cost of construction was repairing expenses for the community water supply construction projects after delivered.
In 2019, costs of sales and services account for 74.12% of revenue from sales and service. The Company’s gross profit was 236 MB accounted for gross profit margin 25.88% which increases, compare with 227.62 MB of gross profit, accounted for gross profit margin 24.62% in previous year.
Selling and Administrative Expenses
In 2019, selling and administrative expenses were 188.61 MB comprised 89.90 MB of selling expenses, 102.10 MB of administrative expenses, 0.58 MB of penalties arising from delays projects and 3.28 MB of loss on disposal of fixed assets, with a reversal of loss on impairment of assets of 7.24 MB.
Total selling and administrative expenses were decrease by 1.45 MB or 0.76% compare to the previous year, mainly due to the record of allowance for doubtful debt for receivables for penalties arising from delays of construction in previous year and the legal expenses was decrease because most of expenses occurred in previous year. However, selling and administrative expenses increase mainly due to the record of employee benefit expense of approximately 8 MB resulting from the change in related laws.
Loss on disposal of fixed assets of 3.28 MB from the disposition of water well drilling machines assets, however, the Company reversal of the loss of asset impairment of 7.24 MB due to already recorded loss from disposal of fixed assets.
The company’s financial cost was 5.17 MB, decreasing by 3 MB or 36.76% compared to financial cost of 8.17 MB in the previous year due to the Company has more financial liquidity. Therefore, the Company paid up the loan from financial institutions.
Net profit
In 2019, the company’s consolidate net profit attributable to equity holders was 41.42 MB, accounted for net profit margin 4.49%, increasing by 4.91 MB or 13.44% compared to net profit of 36.51 MB, accounted for net profit margin 3.91% in the previous year.
Financial Position
Unit: Million baht
| December 31, 2019 | December 31, 2018 | Increased (Decreased) |
% Change | |||
|---|---|---|---|---|---|---|
| Amount | % | Amount | % | |||
| Current Assets | 387.59 | 68.34% | 457.87 | 70.21% | (70.29) | -15.35% |
| Non-Current Assets | 179.56 | 31.66% | 194.24 | 29.79% | (14.68) | -7.56% |
| Total Assets | 567.15 | 100.00% | 652.12 | 100.00% | (84.97) | -13.03% |
| Current Liabilities | 213.39 | 37.54% | 325.3 | 49.78% | (111.92) | -34.40% |
| Non-Current Liabilities | 52.77 | 9.28% | 53.83 | 8.24% | (1.06) | -1.97% |
| Total Liabilities | 266.16 | 46.82% | 379.14 | 58.02% | (112.98) | -29.80% |
| Shareholder's Equity of the Company | 302.29 | 53.18% | 274.28 | 41.98% | 28.01 | 10.21% |
Assets
As of December 31, 2019, the Company’s total assets were 567.15 MB, decreasing by 84.97 MB or 13.03% from December 31, 2018. The decreased assets were mainly from current assets, which decreasing from 64.34 MB of net-inventories, 9.71 MB of trade receivables and other receivables decrease 12.42 MB of contract assets of community water supply construction projects. However, cash and cash equivalents increase 28.54 MB. Non-current assets mainly decrease from property, plant and equipment-net of 14.52 MB from 11.80 MB of depreciation and amortization for the period and disposition of water well drilling machines assets 21.40 MB, the Company has already recorded loss from disposal of fixed assets. Therefore there is a reversal transaction of asset impairment.
Liabilities
As of December 31, 2019, the Company’s total liabilities were 266.16 MB, decreasing by 112.98 MB or 29.80% from December 31, 2018. The decreased of current liabilities mainly due to the decreased of 72.07 MB in short-term loans from financial institution, 37.02 MB of trade and other payables and 4.75 MB of current portion of long-term liabilities under finance leases while current income tax payable increase by 1.56 MB. Non-current liabilities were decrease from 7.95 MB of liabilities under finance lease agreement and 7.14 MB of long-term loan from financial institution, however, provisions for employee benefits was increase 15.16 MB resulting from the change in related laws.
Shareholder’s equity
The company has decreased the registered capital from the original registered capital of 251 MB to the registered capital of 210.50 MB by cutting ordinary shares to support the exercise of warrants PHOL-W1 that has not yet been released and clear the accumulated losses of 89.26 MB by transferring legal reserve amount of 16.20 MB and share premium of 73.06 MB regarding the AGM’s resolution on 24 April 2019.
As of December 31, 2019, Shareholders’ equity was 302.29 MB, increased by 28.01 MB or 10.21% from the resulting from net profit for the period of 41.42 MB, which decreased from the interim dividend payment of 10.13 MB and legal reserve of 2 MB.
Cash Flows
Unit: Million Baht
| Cash Flows | December 31, 2019 | December 31, 2018 |
|---|---|---|
| Cash flow from (used in) operating activities | 128.62 |
139.15 |
| Cash flow from (used in) investing activities | 7.11 |
-1.28 |
| Cash flow from (used in) financing activities | -107.22 |
-172.97 |
| Net increase (decrease) in cash and cash equivalents | 28.51 |
-35.1 |
| Cash and cash equivalents at the end of the period | 85.76 |
57.21 |
The Company’s net cash acquired from the operating activities was 128.62 MB, with operating profits prior to changes in the operating assets and liabilities of 82.60 MB and cash flow received from net-inventories decreased by 60.77 MB, trade and other receivables decreased by 30.62 MB and cash received from income tax refund amounted to 4.29 MB. While, cash flow used for trade and other payables of 36.65 MB and paid for employee benefit of 0.59 MB and income tax of 11.85 MB.
Cash flow acquired from investment activities was 7.11 MB, cash flow received from disposal of fixed assets of 9.26 MB and interest received of 0.57 MB. While, cash flow used to purchase fix assets of 2.57 MB.
Cash flow utilized in financing activities was 107.22 MB mainly used to repayment of loans from financial institutions of 79.21 MB, repayment of liabilities under lease agreement of 13.36 MB, interim dividend payment of 10.13 MB and interest expense of 4.52 MB.
Management Discussion & Analysis (MD&A) Quarter 3 /2019
Overview
Phol Dhanya Public Company Limited (the Company) consolidated financial statement of the third quarter, ending September 30, 2019 reported the revenue from sales and services of 227.58 MB decreasing by 6.92 MB or 2.95%, compared to the revenue from sales and services of 234.50 MB in the same quarter of previous year. Revenue from sales decreased because industrial sector customers have reduced their production capacity due to the economic slowdown. Revenue from services decreased due to project postponement. However, in Quarter 3/2019, the Company’s gross profit was 60.64 MB, accounted for gross profit margin of 26.65%, gross profit was increase, compare with gross profit of 58.97 MB, accounted for gross profit margin of 25.15% in the same quarter of previous year. In addition, selling and administrative expenses were decreases, as the results for the Company’s net profit attributable to equity holders of 12.12 MB, accounted for net profit margin of 5.28% in quarter 3/2019, increasing by 7.03 MB or 138.05% compare with net profit attributable to equity holders of 5.09 MB, accounted for net profit margin of 2.15% in the same quarter of previous year
For the nine months period, ending September 30, 2019, The Company’s revenue from sales and services totals 689.34 MB, decreasing by 2.63 MB or 0.38%, compared to the revenue from sales and services of 691.97 MB in the same period of previous year. The Company’s consolidate net profit attributable to equity holders of 26.37 MB, representing a net profit margin of 3.78%
Operating performance
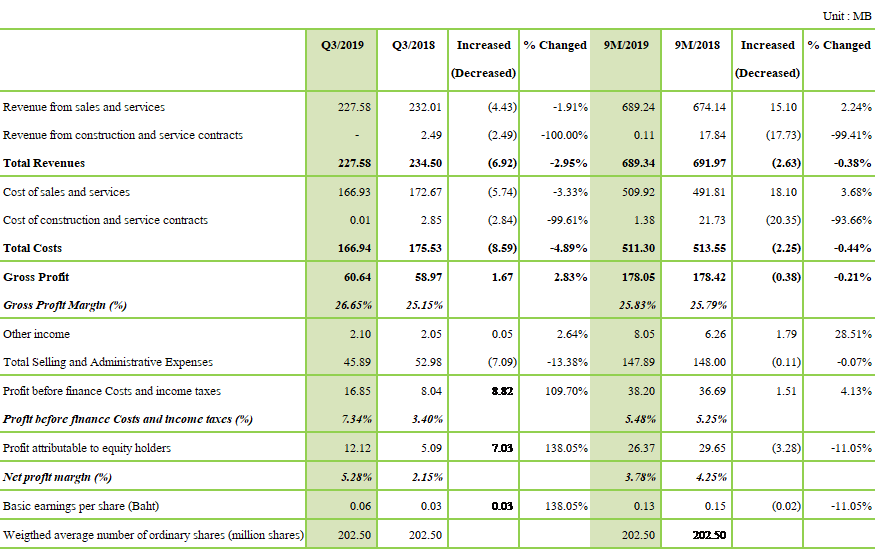
Revenue
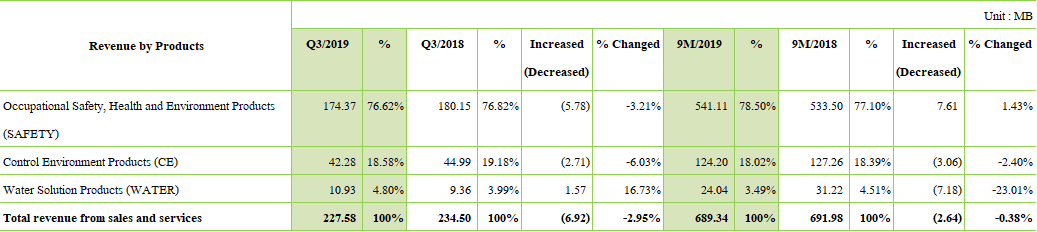
In Quarter 3/2019, the Company’s revenue from sales and services were 227.58 MB, comprise 223.46 MB of revenue from sales and 4.12 MB of revenue from services. Revenues from sales and services decreases by 6.92 MB or 2.95% compared to the same quarter of previous year.
Revenue from Occupational Safety, Health and Environment Products or SAFETY was 174.37 MB, decreasing by 5.78 MB or 3.21% compared to the same quarter of previous year, Revenue from sales decreased from economic slowdown. Revenue from services decreased due to Customers reduced budget and postponed project. However, revenue from government sector and new customers were increase. The revenue from Control Environment Products or CE was 42.28 MB, decreasing by 2.71 MB or 6.03% compared to the same quarter of previous year, major customers are in the electronics industry reduce production capacity according to the slowing export market. Revenue from Water Solution Products or WATER was 10.93 MB, increasing by 1.57 MB or 16.73% compared to the same quarter of previous year, due to revenue from sales and services in industrial project sector.
Cost of Sales and Services
The Company’s total costs in Quarter 3/2019 were 166.94 MB, comprising of 163.64 MB cost of sales, 3.29 MB cost of services and 0.01 MB cost of construction. Cost of sales and services decreased proportionally with less revenue from sales and services and cost of sales has dropped following the Baht appreciation and cost of sales had lower than previous year. In quarter 3/2019, costs of sales and services account for 73.35% of revenue from sales and service. Gross profit margin was 26.65% which increase, compare with 25.15% in the same quarter of previous year.
Selling and Administrative Expenses
In Quarter 3/2019, selling and administrative expenses were 45.89 MB comprised 22.20 MB of selling expenses and 25.44 MB of administrative expenses, with a reversal of loss on impairment of assets of 1.74 MB. Total selling and administrative expenses were decrease by 7.09 MB or 13.38% compare to the same quarter of previous year, mainly due to the record of allowance for doubtful debt for receivables for penalties arising from delays of construction in previous year and the legal expenses was decrease because most of expenses occurred in previous year. In addition, the Company reversal of the loss of asset impairment of 1.74 MB due to the disposition of assets in quarter 3/2019, while loss for impairment of asset of 3.99 MB in the same quarter of previous year.
The company’s financial cost was 1.22 MB, decreasing by 0.49 MB or 28.67% compared to financial cost of 1.72 MB in the same quarter of previous year due to the Company has more financial liquidity. Therefore, the Company paid up the loan from financial institutions.
Net profit
In Quarter 3/2019, the company’s consolidate net profit attributable to equity holders was 12.12 MB, accounted for net profit margin 5.28%, increasing by 7.03 MB or 138.05% compared to net profit of 5.09 MB, accounted for net profit margin 2.15% in the same quarter of previous year.
Financial Position
Unit : MB
| As of September 30, 2019 | As of December 31, 2018 | Increased (Decreased) |
% Change | |||
|---|---|---|---|---|---|---|
| Amount | % | Amount | % | |||
| Current Assets | 411.54 | 68.94% | 457.87 | 70.21% | -46.33 | -10.12% |
| Non-Current Assets | 185.4 | 31.06% | 194.24 | 29.79% | -8.84 | -4.55% |
| Total Assets | 596.94 | 100.00% | 652.12 | 100.00% | -55.17 | -8.46% |
| Current Liabilities | 254.8 | 42.59% | 325.3 | 49.78% | -70.5 | -21.67% |
| Non-Current Liabilities | 52.85 | 8.83% | 53.83 | 8.24% | -0.98 | -1.83% |
| Total Liabilities | 307.65 | 51.43% | 379.14 | 58.02% | -71.49 | -18.86% |
| Shareholder's Equity of the Company | 290.6 | 48.57% | 274.28 | 41.98% | 16.31 | 5.95% |
Assets
As of September 30, 2019, the Company’s total assets were 596.94 MB, decreasing by 55.17 MB or 8.46% from December 31, 2018. The decreased assets were mainly from current assets, which decreasing from 37.90 MB of net-inventories, 11.01 MB of unbilled receivables to the subcontractors for the construction and 10.91 MB of other receivables. However, cash and cash equivalents increase 10.46 MB and trade receivables increase 2.72 MB. Non-Current Assets mainly decrease from property, plant and equipment-net of 9.87 MB from disposition some of assets for drilling machines and depreciation and amortization for the period.
Liabilities
As of September 30, 2019, the Company’s total liabilities were 307.65 MB, decreasing by 71.49 MB or 18.86% from December 31, 2018. The decreased of current liabilities mainly due to the decreased of 42.02 MB in short-term loans from financial institution and 26.71 MB of trade and other payables. Non-Current Liabilities were decrease from 5.10 MB of liabilities under finance lease agreement and 5.36 MB of long-term loan from financial institution however, provisions for employee benefits was increase 10.42 MB.
Shareholder's equity
The company has decreased the registered capital from the original registered capital of 251 MB to the registered capital of 210.50 MB by cutting ordinary shares to support the exercise of warrants PHOL-W1 that has not yet been released and clear the accumulated losses of 89.26 MB by transferring legal reserve amount of 16.20 MB and share premium of 73.06 MB regarding the AGM’s resolution on 24 April 2019.
As of September 30, 2019, Shareholders’ equity was 290.60 MB, increased from the resulting from net profit for the period of 26.37 MB, which decreased from the interim dividend payment of 10.12 MB and legal reserve of 0.72 MB.
Cash Flows
Unit : MB
| Cash Flows | September 30, 2019 | September 30, 2018 |
|---|---|---|
| Cashflow from (used in) operating activities | 77.9 | 114.81 |
| Cashflow from (used in) investing activities | 0.82 | -1.3 |
| Cashflow from (used in) financing activities | -68.33 | -139.82 |
| Net increase (decrease) in cash and cash equivalents | 10.39 | -26.31 |
| Cash and cash equivalents at the end of the period | 67.67 | 66.01 |
The Company’s net cash acquired from the operating activities was 77.90 MB, with operating profits prior to changes in the operating assets and liabilities of 60.43 MB and cash flow received from net-inventories decreased by 35.47 MB, unbilled receivables for the construction 11.01 MB, trade and other payables decreased by 4.24 MB and Cash received from income tax refund amounted to 4.29 MB. While, cash flow used for trade and other payables of 25.26 MB and paid for income tax of 11.54 MB.
Cash flow acquired from investment activities was 0.82 MB, cash flow received from disposal of fixed assets of 3.04 MB and interest received of 0.41 MB. While, cash flow used to purchase fix assets of 2.32 MB.
Cash flow utilized in financing activities was 68.33 MB mainly used to repayment of loans from financial institutions of 47.38 MB, repayment of liabilities under lease agreement of 7.22 MB, interim dividend payment of 10.12 MB and interest expense of 3.61 MB.
Management Discussion & Analysis (MD&A) Quarter 2/2019
Overview
Phol Dhanya Public Company Limited (the Company) consolidated financial statement of the second quarter, ending June 30, 2019 reported the revenue from sales and services of 221.79 MB increasing by 2.72 MB or 1.24%, compared to the revenue from sales and services of 219.07 MB in the same quarter of previous year. In Quarter 2/2019, the Company’s gross profit was 55.06 MB, accounted for gross profit margin of 24.83%, gross profit was decrease, compare with gross profit of 62.53 MB, accounted for gross profit margin of 28.54% in the same quarter of previous year due to competition situation and the proportion of sales of products with low gross margin increases. Selling and administrative expenses were 55.19 MB increasing by 5.64 MB or 11.39%, due to the record of employee benefit expense. As the operating results for Quarter 2/2019, the Company’s net profit attributable to equity holders of 1.73 MB, accounted for net profit margin of 0.77%,
For the six months period, ending June 30, 2019, The Company’s revenue from sales and services totals 461.76 MB, increasing 4.29 MB or 0.94%, compared to the revenue from sales and services of 457.47 MB in the same period of previous year. The Company’s consolidate net profit attributable to equity holders of 14.25 MB, representing a net profit margin of 3.05%.
Operating performance
Unit : MB
| Q2/2019 | Q2/2018 | Increased (Decreased) |
% Changed | 6M/2019 | 6M/2018 | Increased (Decreased) |
% Changed | |
|---|---|---|---|---|---|---|---|---|
| Revenue from sales and service | 221.79 | 215.26 | 6.53 | 3.03% | 461.66 | 442.13 | 19.53 | 4.42% |
| Revenue from construction and service contracts | - | 3.81 | (3.81) | -100.00% | 0.11 | 15.35 | (15.24) | -99.31% |
| Total Revenue | 221.79 | 219.07 | 2.72 | 1.24% | 461.76 | 457.47 | 4.29 | 0.94% |
| Cost of sales and service | 166.03 | 154.96 | 11.06 | 7.14% | 342.99 | 319.14 | 23.85 | 7.47% |
| Cost of construction and service contracts | 0.71 | 1.58 | (0.87) | -55.23% | 1.37 | 18.88 | (17.51) | -92.76% |
| Total Costs | 166.73 | 156.54 | 10.19 | 6.51% | 344.36 | 338.02 | 6.34 | 1.87% |
| Gross Profit | 55.06 | 62.53 | (7.47) | -11.95% | 117.41 | 119.46 | (2.05) | -1.72% |
| Gross Profit (%) | 24.83% | 28.54% | 25.43% | 26.11% | ||||
| Other Income | 3.83 | 2.25 | 1.58 | 70.31% | 5.95 | 4.29 | 1.66 | 38.72% |
| Total Selling and Administrative Expenses | 55.19 | 49.55 | 5.64 | 11.39% | 102.00 | 95.09 | 6.91 | 7.27% |
| Profit before Finance Costs and Income Taxes Expense | 3.71 | 15.24 | (11.53) | -75.68% | 21.35 | 28.65 | (7.30) | -25.49% |
| Profit before Finance Costs and Income Taxes Expense (%) | 1.64% | 6.89% | 4.56% | 6.20% | ||||
| Profit attributable to equity holders | 1.73 | 16.09 | (14.36) | -89.22% | 14.25 | 24.55 | (10.31) | -41.98% |
| Net Profit (%) | 0.77% | 7.27% | 3.05% | 5.32% | ||||
| Basic earnings per share (Baht) | 0.01 | 0.08 | (0.07) | -89.22% | 0.07 | 0.12 | (0.05) | -41.98% |
| Weighted average number of ordinary shares (Million shares) | 202.50 | 202.50 | 202.50 | 202.50 |
Revenue
Unit : MB
| Revenue structure | Q2/2019 | % | Q2/2018 | % | Increased (Decreased) |
% Changed | M6/2019 | % | M6/2018 | % | Increased (Decreased) |
% Changed |
|---|---|---|---|---|---|---|---|---|---|---|---|---|
| Occupational Safety, Health and Environment Products (SAFETY) | 170.92 | 77.06% | 169.83 | 77.52% | 1.09 | 0.64% | 366.73 | 79.42% | 353.35 | 77.24% | 13.38 | 3.79% |
| Control Environment Products (CE) | 40.99 | 18.48% | 42.57 | 19.43% | (1.58) | -3.70% | 81.92 | 17.74% | 82.27 | 17.98% | (0.35) | -0.42% |
| Water Solution Products (WATER) | 9.88 | 4.46% | 6.68 | 3.05% | 3.21 | 48.05% | 13.11 | 2.84% | 21.86 | 4.78% | (8.75) | -40.04% |
| Total revenue from sales and services | 221.79 | 100% | 219.07 | 100% | 2.72 | 1.24% | 461.76 | 100% | 457.47 | 100% | 4.29 | 0.94% |
In Quarter 2/2019, the Company’s revenue from sales and services were 221.79 MB, comprise 213.98 MB of revenue from sales and 7.82 MB of revenue from services. Revenues from sales and services increased slightly to 1.24% compared to the same quarter of previous year.
Revenue from Occupational Safety, Health and Environment Products or SAFETY was 170.92 MB, increasing by 1.09 MB or 0.64% compared to the same quarter of previous year, revenue from government sector and new customers were increase, however, revenue from existing customers in some sectors were decrease such as petrochemical industry, due to competition situation and reduced budget for orders. The revenue from Control Environment Products or CE was 40.99 MB, decreasing by 1.58 MB or 3.70% compared to the same quarter of previous year, major customers are in the electronics industry reduce production capacity according to the slowing export market. Revenue from Water Solution Products or WATER was 9.88 MB, increasing by 3.21 MB or 48.05% compared to the same quarter of previous year, due to revenue from sales and services in industrial project sector.
Cost of Sales and Services
The Company’s total costs in Quarter 2/2019 were 166.73 MB, comprising of 159.76 MB cost of sales, 6.26 MB cost of services and 0.71 MB cost of construction. Cost of sales and services increased proportionally with more revenue from sales and services. Cost of construction was repairing expenses for the community water supply construction projects after delivered.
In quarter 2/2019, costs of sales and services account for 75.17% of revenue from sales and service. Gross profit margin was 24.83% which decrease, compare with 28.54% in the same quarter of previous year, due to competition situation and the proportion of sales of products with low gross margin increases. In addition, revenue from services in water projects had a low gross profit margin.
Selling and Administrative Expenses
In Quarter 2/2019, selling and administrative expenses were 55.19 MB comprised 23.94 MB of selling expenses, 31.03 MB of administrative expenses and 0.22 of penalties arising from delays projects. Total selling and administrative expenses were decrease by 5.64 MB or 11.39% compare to the same quarter of previous year, mainly due to the record of employee benefit expense, however, the legal expenses was decrease from previous year.
The company’s financial cost was 1.32 MB, decreasing by 0.86 MB or 39.43% compared to financial cost of 2.18 MB in the same quarter of previous year due to the decrease in loan from financial institution.
Net profit
In Quarter 2/2019, the company’s consolidate net profit attributable to equity holders was 1.73 MB, accounted for net profit margin 0.77%.
Financial Position
Unit : MB
| June 30, 2019 | December 31, 2018 | Increased (Decreased) |
% Change | |||
|---|---|---|---|---|---|---|
| Amount | % | Amount | % | |||
| Current Assets | 443.32 | 70.03% | 457.87 | 70.21% | (14.55) | -3.18% |
| Non-Current Assets | 189.75 | 29.97% | 194.24 | 29.79% | (4.50) | -2.32% |
| Total Assets | 633.07 | 100.00% | 652.12 | 100% | (19.05) | -2.92% |
| Current Liabilities | 289.66 | 45.66% | 325.30 | 49.78% | (35.64) | -10.96% |
| Non-Current Liabilities | 55.83 | 8.80% | 53.83 | 8.24% | 1.99 | 3.70% |
| Total Liabilities | 345.49 | 54.46% | 379.14 | 58.02% | (33.65) | -8.88% |
| Shareholder's Equity of the Company | 288.89 | 45.54% | 274.28 | 41.98% | 14.60 | 5.32% |
Assets
As of June 30, 2019, the Company’s total assets were 633.07 MB, decreasing by 19.05 MB or 2.92% from December 31, 2018. The decreased assets were mainly from current assets, which decreasing from 9.50 MB of unbilled receivables to the subcontractors for the construction, 14.14 MB of net-inventories. While, cash and cash equivalents increase 10.89 MB and trade receivables increase 3.63 MB. Non-Current Assets mainly decrease from property, plant and equipment-net of 6.92 MB from disposition of assets for drilling machines and depreciation and amortization for the period.
Liabilities
As of June 30, 2019, the Company’s total liabilities were 345.49 MB, decreasing by 33.65 MB or 8.88% from December 31, 2018. The decreased of current liabilities mainly due to the decreased of 26.56 MB in short-term loans from financial institution and 10.77 MB of trade and other payables, however, accrued income tax was increase 1.99 MB. Non-Current Liabilities were increase from 9.31 MB of provisions for employee benefits, while, liabilities under finance lease agreement was decrease 3.02 MB and long-term loan from financial institution was decrease 3.57 MB
Shareholder's equity
The company has decreased the registered capital from the original registered capital of 251 MB to the registered capital of 210.50 MB by cutting ordinary shares to support the exercise of warrants PHOL-W1 that has not yet been released and clear the accumulated losses of 89.26 MB by transferring legal reserve amount of 16.20 MB and share premium of 73.06 MB regarding the AGM’s resolution on 24 April 2019.
As of June 30, 2019, Shareholders’ equity was 288.89 MB, with the premium on share of 64.78 MB and unappropriated retained earnings of 22.80 MB.
Cash Flows
Unit : MB
| Cash Flows | June 30, 2019 | June 30, 2018 |
|---|---|---|
| Cashflow from (used in) operating activities | 47.05 | 80.07 |
| Cashflow from (used in) investing activities | 0.36 | (0.91) |
| Cashflow from (used in) financing activities | (36.84) | (104.46) |
| Net increase (decrease) in cash and cash equivalents | 10.57 | (25.30) |
| Cash and cash equivalents at the end of the period | 68.10 | 66.84 |
The Company’s net cash acquired from the operating activities was 47.05 MB, with operating profits prior to changes in the operating assets and liabilities of 40.06 MB and cash flow received from 9.50 MB of unbilled receivables for the construction, net-inventories decreased 11.35 MB and trade and other payables decreased 2.60 MB. While, cash flow used for trade and other payables of 11.26 MB and paid for income tax of 5.18 MB.
Cash flow acquired from investment activities was 0.36 MB, cash flow received from disposal of fixed assets of 1.23 MB and interest received of 0.27 MB. While, cash flow used to purchase fix assets of 0.82 MB.
Cash flow utilized in financing activities was 36.84 MB mainly used to repayment of loans from financial institutions of 30.13 MB and repayment of liabilities under lease agreement of 4.24 MB and interest expense of 2.48 MB.
Management Discussion & Analysis (MD&A) Quarter 1/2019
Overview
Phol Dhanya Public Company Limited (the Company) consolidated financial statement of the first quarter, ending March 31, 2019 reported the total revenue of 242.08 MB, comprise 239.86 MB of revenue from sales and services 0.11 MB of revenue from construction contracts and 2.11 MB of others revenue. Revenue from sales and services increasing by 13 MB or 5.73%, compared to the revenue from sales and services of 226.86 MB in the same quarter of previous year due to the increase of revenue from Occupational Safety, Health and Environment Products or SAFETY and Control Environment Products or CE. In Quarter 1/2019, the Company’s gross profit was 62.34 MB, accounted for gross profit margin of 25.98%, gross profit was increase by 5.42 MB or 9.52% according to the increase in revenue from sales, in addition, cost overrun for the community water supply construction projects was decrease, compare with gross profit of 56.92 MB, accounted for gross profit margin of 23.88% in the same quarter of previous year. Selling and administrative expenses were 46.81 MB, similar to the same quarter of previous year. The operating results for Quarter 1/2019, the Company’s net profit attributable to equity holders of 12.51 MB, accounted for net profit margin of 5.17%, increasing by 4.05 MB or 47.89% compared to net profit attributable to equity holders of 8.46 MB, accounted for net profit margin of 3.98% in the same quarter of previous year
Operating performance
Unit : MB
| Q1/2019 | Q1/2018 | Increased (Decreased) |
% Changed | |
|---|---|---|---|---|
| Revenue from sales and services | 239.86 | 226.86 | 13.00 | 5.73% |
| Revenue from construction and service contracts | 0.11 | 11.54 | (11.43) | -99.09% |
| Other Revenue | 2.11 | 3.78 | (1.66) | -44.04% |
| Total Revenue | 242.08 | 242.18 | (0.10) | -0.04% |
| Cost of sales and services | 176.96 | 164.18 | 12.79 | 7.79% |
| Cost of construction and service contracts | 0.66 | 17.30 | (16.64) | -96.18% |
| Total Costs | 177.62 | 181.48 | (3.85) | -2.12% |
| Gross Profit | 62.34 | 56.92 | 5.42 | 9.52% |
| Gross ProfitMargin (%) | 25.98% | 23.88% | ||
| Total Selling & Administrative Expenses | 46.81 | 47.29 | (0.47) | -1.00% |
| Profit before finance Costs and income taxes | 15.53 | 9.63 | 5.89 | 61.17% |
| Profit (Loss) before Finance Costs and Income Taxes Expense (%) | 6.41% | 3.98% | ||
| Profit attributable to equity holders | 12.51 | 8.46 | 4.05 | 47.89% |
| Net Profit (Loss) (%) | 5.17% | 3.49% | ||
| Basic earnings per share (Baht) | 0.06 | 0.04 | 0.02 | 47.89% |
Revenue
Unit : MB
| Q12019 | % | Q12018 | % | Increased (Decreased) |
% Changed | |
|---|---|---|---|---|---|---|
| Occupational Safety, Health and Environment Products (SAFETY) | 195.82 | 82% | 183.52 | 77% | 12.30 | 6.70% |
| Control Environment Products (CE) | 40.93 | 17% | 39.70 | 17% | 1.23 | 3.10% |
| Water Solution Products (WATER) | 3.22 | 1% | 15.18 | 6% | (11.96) | -78.78% |
| Total revenue from sales and services | 239.97 | 100% | 238.4 | 100% | 1.57 | 0.66% |
In Quarter 1/2019, the Company’s revenue from sales and services were 239.97 MB, comprise 236.41 MB of revenue from sales, 3.45 MB of revenue from services and 0.11 MB of revenue from construction contracts. Revenues from sales and services increased slightly to 0.66% compared to the same quarter of previous year. Revenue from Occupational Safety, Health and Environment Products or SAFETY was 195.82 MB, increasing by 12.30 MB or 6.7% compared to the same quarter of previous year, due to increase in revenue from government sector and increased in revenue of masks from bad situation of dust PM 2.5. The revenue from Control Environment Products or CE was 40.93 MB, increasing by 1.23 MB or 3.10% compared to the same quarter of previous year, major customers are in the electronics industry are still continuous orders. Revenue from Water Solution Products or WATER was 3.22 MB, decreasing by 11.96 MB or 78.78% compared to the same quarter of previous year, Major revenue from sales and services in industrial project sector. However, revenue from the community water supply construction projects were decrease due to stop receive new project
Cost of Sales and Services
The Company’s total costs in Quarter 1/2019 were 177.62 MB, comprising of 174.33 MB cost of sales, 2.63 MB cost of services and 0.66 MB cost of construction. Cost of sales increased proportionally with more revenue from sales. Cost of service decrease proportionally with revenue from services and cost of construction decreased proportionally with revenue recognized from construction contracting service.
In quarter 1/2019, costs of sales and services account for 74.02% of revenue from sales and service. Gross profit margin was 25.98% which increase, compare with 23.88% in the same quarter of previous year, due to cost overrun for the construction projects was decrease. In Quarter 1/2019, the Company’s gross profit was 62.34 MB, increasing by 5.42 MB or 9.52% compared to gross profit of 56.92 MB in the same quarter of previous year
Selling and Administrative Expenses
In Quarter 1/2019, selling and administrative expenses were 46.81 MB comprised 22.90 MB of selling expenses, 23.55 MB of administrative expenses and 0.37 of penalties arising from delays projects. Total selling and administrative expenses were similar to the same quarter of previous year, which decreased by 0.47 MB or 1% mainly due to the decreased in the legal expenses from previous year.
The company’s financial cost was 1.50 MB, decreasing by 1.14 MB or 49.09% compared to financial cost of 2.64 MB in the same quarter of previous year due to the decrease in loan from financial institution.
Net profit
In Quarter 1/2019, the company’s consolidate net profit attributable to equity holders was 12.51 MB, accounted for net profit margin 5.17%, increasing by 4.05 MB or 47.89% compared to net profit attributable to equity holders of 8.46 MB in the same quarter of previous year, accounted for net profit margin 3.49%.
Financial Position
Unit : MB
| March 31, 2019 | December 31, 2018 | Increased (Decreased) |
% Change | |||
|---|---|---|---|---|---|---|
| Amount | % | Amount | % | |||
| Current Assets | 428.10 | 69.16% | 457.87 | 70.21% | (29.77) | -6.50% |
| Non-Current Assets | 190.91 | 30.84% | 194.24 | 29.79% | (3.33) | -1.72% |
| Total Assets | 619.01 | 100.00% | 652.12 | 100.00% | (33.10) | -5.08% |
| Current Liabilities | 281.88 | 45.44% | 325.30 | 49.78% | (43.42) | -13.35% |
| Non-Current Liabilities | 51.51 | 8.30% | 53.83 | 8.24% | (2.33) | -4.32% |
| Total Liabilities | 333.39 | 53.74% | 379.14 | 58.02% | (45.75) | -12.07% |
| Shareholder's Equity of the Company | 286.93 | 46.26% | 274.28 | 41.98% | 12.65 | 4.61% |
Assets
As of March 31, 2019, the Company’s total assets were 619.01 MB, decreasing by 33.10 MB or 5.08% from December 31, 2018. The decreased assets were mainly from current assets, which decreasing from 16.28 MB of cash and cash equivalents, 7.41 MB of unbilled receivables to the subcontractors for the construction, 20.69 MB of net-inventories. While, , trade and other current receivables increase 15.97 MB.
Liabilities
As of March 31, 2019, the Company’s total liabilities were 333.39 MB, decreasing by 45.75 MB or 12.07% from December 31, 2018. The decreased liabilities mainly due to the decreased of 21.52 MB in short-term loans from financial institution and 26.02 MB of trade and other payables, 1.26 MB of liabilities under finance lease agreement and 1.79 MB of long-term loan from financial institution. However, accrued income tax was increase 3.88 MB and the recorded provision for expected loss on constructions contracts was increase 0.35 MB.
Shareholder's equity
As of March 31, 2019, Shareholders’ equity was 286.93 MB, increased from the resulting from net profit of 12.51 MB.
Cash Flows
Unit : MB
| Cash Flows | March 31, 2019 | March 31, 2018 |
|---|---|---|
| Cashflow from (used in) operating activities | 9.62 | 36.77 |
| Cashflow from (used in) investing activities | 0.04 | (0.48) |
| Cashflow from (used in) financing activities | (26.06) | (31.50) |
| Net increase (decrease) in cash and cash equivalents | (16.40) | 4.80 |
| Cash and cash equivalents at the end of the period | 40.93 | 97.31 |
The Company’s net cash acquired from the operating activities was 9.62 MB, with operating profits prior to changes in the operating assets and liabilities of 24.33 MB and cash flow received from 7.41 MB of unbilled receivables for the construction and net-inventories decreased 19.82 MB. While, cash flow used for trade and other payables of 26.50 MB, cash paid for projects warranty of 0.61 MB and trade and other receivables increased 14.45 MB.
Cash flow acquired from investment activities was 0.04 MB from interest received of 0.12 MB and loan to employees decreased 0.10 MB. While, cash flow used to purchase fix assets of 0.14 MB.
Cash flow utilized in financing activities was 26.06 MB mainly used to repayment of loans from financial institutions of 23.30 MB and repayment of liabilities under lease agreement of 1.51 MB and interest expense of 1.25 MB.
Management Discussion & Analysis (MD&A) Quarter 1/2018
Overview
In its consolidated financial statements as of March 31, 2018, Phol Dhanya Pubic Company Limited (The Company) recorded revenue from sales and services of 238.40 MB, decreasing 9.82 MB or 3.96% compared to the revenue from sales and services of 248.22 MB in the same quarter of previous year, due to the revenue from construction contracting service of the community water supply projects decreased compared with the same quarter of previous year. In quarter 1/2018, the Company's selling and administrative expenses and penalties arising from delays of constructions were decrease, so the net profit attributable to equity holders of the Company was 8.46 MB, increasing by 19.45 MB or 177.01% compared with net loss attributable to equity holders of 10.99 MB in the same quarter of previous year.
Operating performance
Unit : MB
| Q1/2018 | Q1/2017 | % YoY | |
|---|---|---|---|
| Revenue from sales | 221.04 | 214.08 | 3.25% |
| Revenue from rendering of services | 5.82 | 8.58 | -32.15% |
| Revenue from construction and service contracts | 11.54 | 25.56 | -54.86% |
| Other Revenue | 3.78 | 1.88 | 101.03% |
| Total Revenue | 242.18 | 250.1 | -3.17% |
| Cost of sales | 159.2 | 156.89 | 1.47% |
| Cost of rendering of services | 4.98 | 5.83 | -14.62% |
| Cost of construction and service contracts | 17.3 | 25.98 | -33.39% |
| Total Costs | 181.48 | 188.69 | -3.82% |
| Gross Profit | 56.92 | 59.53 | -4.38% |
| Gross Profit (%) | 23.88% | 23.98% | |
| Total Selling & Administrative Expenses | 47.29 | 70.17 | -32.61% |
| Profit (Loss) before Finance Costs and Income Taxes Expense | 13.41 | -8.77 | 252.97% |
| Profit (Loss) before Finance Costs and Income Taxes Expense (%) | 5.54% | -3.51% | |
| Profit (Loss) attributable to equity holders | 8.46 | -10.99 | 177.01% |
| Net Profit (Loss) (%) | 3.49% | -4.39% | |
| Basic earnings per share (Baht) | 0.04 | -0.05 | 177.01% |
| Weighted average number of ordinary shares (Million shares) | 202.5 | 202.5 |
Revenue
Unit : MB
| Q12018 | % | Q12017 | % | % YoY | |
|---|---|---|---|---|---|
| Occupational Safety, Health and Environment Products (SAFETY) | 183.52 | 77% | 183.52 | 74% | 0.00% |
| Control Environment Products (CE) | 39.7 | 17% | 37.06 | 15% | 7.11% |
| Water Solution Products (WATER) | 15.18 | 6% | 27.64 | 11% | -45.07% |
| Total revenue from sales and services | 238.4 | 100% | 248.22 | 100% | -3.96% |
In Quarter 1/2018, the Company's sales and services were 238.40 MB, comprise 221.04 MB of revenue from sales, 5.82 MB of revenue from services and 11.54 MB of revenue from construction contracts. Total revenue decreased by 9.82 MB or 3.96%, compared with 248.22 MB in the same quarter of previous year. Revenue from Occupational Safety, Health and Environment Products or SAFETY was 183.52 MB, which similar to the same quarter of previous year. Revenues from major industry customers such as automotive industry, petrochemical industry and construction industry were increase, however, revenue from sales in government sector customers were decrease compared with the same quarter of previous year. The revenue from Control Environment Products or CE was 39.70 MB, increasing by 2.64 MB or 7.11% compared with the same quarter of previous year. Major customers are in the electronics industry. Revenue from Water Solution Products or WATER was 15.18 MB, decreasing by 12.46 MB or 45.07% compared with the same quarter of previous year, due to revenue from construction contracting service of the community water supply project was decreased.
Cost of Sales and Services
The Company's total costs in Quarter 1/2018 were 181.48 MB, comprising of 159.20 MB cost of sales, 4.98 MB cost of services and 17.30 MB cost of construction. Cost of sales increased proportionally with more revenue from sales. Cost of service decrease proportionally with revenue from services. Cost of construction decreased proportionally with revenue recognized from construction contracting service. In quarter 1/2018, costs of sales and services account for 72.37% of sales and service revenue. Gross profit margin from sales and services was 27.63% which increase, compare with 26.92% of the same quarter of previous year, due to the increase of sales of high margin products and cost of goods decreased from the appreciation of baht. Cost of construction was high than revenue due to the extra cost to rush the project completion. In Quarter 1/2018, the Company's gross profit was 56.92 MB accounted for net profit margin 23.88% which decrease, compare with 23.98% of the same quarter of previous year./p>
Selling and Administrative Expenses
In Quarter 1/2018, selling and administrative expenses were 47.29 MB comprised 22.36 MB of selling expenses, 24.05 MB of administrative expenses and 0.88 of penalties arising from delays projects. For more efficiency, the selling and admin expenses were decreased, since the Company issues a policy to reduce unnecessarily costs, however the administration cost has been increased such as the legal action against a group of abandoned sub-contractor.
In Quarter 1/2018, the company's financial cost was 2.64 MB, decreasing due to the decrease in loan from financial institution.
Net profit
In Quarter 1/2018, the company's consolidate net profit attributable to equity holders of the Company was 8.46 MB, accounted for net profit margin 3.49%, increasing by 19.45 MB or 177.01% compared with net loss 10.99 MB in the previous year.
Financial Position
Unit : MB
| March 31, 2018 | December 31, 2017 | % Change | |||
|---|---|---|---|---|---|
| Amount | % | Amount | % | ||
| Current Assets | 536.04 | 72.07% | 576.63 | 73.22% | -7.04% |
| Non-Current Assets | 207.71 | 27.93% | 210.85 | 26.78% | -1.49% |
| Total Assets | 743.75 | 100.00% | 787.48 | 100% | -5.55% |
| Current Liabilities | 431.94 | 58.00% | 484.34 | 61.40% | -10.82% |
| Non-Current Liabilities | 66.62 | 8.95% | 69.02 | 8.75% | -3.47% |
| Total Liabilities | 498.56 | 66.92% | 553.36 | 70.15% | -9.90% |
| Shareholder's Equity of the Company | 246.49 | 33.08% | 235.43 | 29.85% | 4.70% |
Assets
As of March 31, 2018, the Company's total assets equaled 743.75 MB, decreasing by 43.74 MB or 5.55% from December 31, 2017. The decreased assets were mainly from current assets decreasing from 37.23 MB of unbilled receivables and prepaid expenses to the subcontractors for the construction, 14.02 MB of net-inventories and 3.67 MB of current tax assets. While, cash and cash equivalents increase 5.05 MB, trade and other current receivables increase 9.29 MB.
Liabilities
As of March 31, 2018, the Company's total liabilities equaled 498.56 MB, decreasing by 54.80 MB or 9.90% from December 31, 2017. The decreased liabilities mainly due to the decreased of 25.47 MB in short-term loans from financial institution and 35.56 MB of trade payables. However, the recorded provision for expected loss on constructions contracts was increased 6.86 MB and accrued income tax was increase 4.01 MB.
Shareholder's equity
As of March 31, 2018, Shareholders' equity was 246.49 MB, increased from the resulting from net profit of 8.46 MB.
Cash Flows
Unit : MB
| Cash Flows | March 31, 2018 | March 31, 2017 |
|---|---|---|
| Cashflow from (used in) operating activities | 36.77 | -7.38 |
| Cashflow from (used in) investing activities | -0.48 | -31.85 |
| Cashflow from (used in) financing activities | -31.5 | 127.37 |
| Net increase (decrease) in cash and cash equivalents | 4.8 | 88.14 |
| Cash and cash equivalents at the end of the period | 97.31 | 137.25 |
The Company's net cash acquired from the operating activities was 36.77 MB, with operating profits prior to changes in the operating assets and liabilities of 26.47 MB and cash flow received from 37.23 MB of unbilled receivables and prepaid expenses to the subcontractors for the construction and net-inventories decreased 13.35 MB. While, cash flow used for trade and other payable of 37.99 MB.
Cash flow utilized in investment activities was 0.48 MB mainly used to purchase fix assets and intangible assets of 0.28 MB and 0.33 MB to loan to employees.
Cash flow utilized in financing activities was 31.50 MB mainly used to repayment of loans from financial institutions of 27.25 MB and repayment of liabilities under lease agreement of 1.63 MB and interest expense of 2.62 MB.
Management Discussion & Analysis (MD&A) Quarter 2/2018
Overview
Phol Dhanya Public Company Limited (the Company)’s consolidated Financial statement of the second quarter, ending June 30, 2018 reported the revenue from sales and service of 219.07 MB, decreasing by 33.07 MB or 13.12%, compared to the revenue from sales and services of 252.15 MB in the same quarter of previous year. The reduction has mainly been due to the fact that there have been no new assignments from the community water supply construction projects from the government. The revenue reported was realized from completed portions of projects in execution. Nevertheless, the Company’s cost of sales has dropped following the Baht appreciation at the beginning of the year and cost overrun for the community water supply construction projects was decrease, leading to gross profit of 65.53 MB in quarter 2/2018, increasing by 31.33 MB or 100.43%, compared to gross profit of 31.20 MB in the same quarter of previous year. In quarter 2/2018, selling and administrative expenses have decreased, mainly because the Company has allocated allowance for doubtful debt for receivables for penalties arising from delays of construction of 60.50 MB in quarter 2/2017. The results in net profit attributable to equity holders of 16.09 MB in quarter 2/2018, increasing by 101.72 MB or 118.80% compared to net loss attributable to equity holders of 85.63 MB in the same quarter of previous year.
For the six months period, ending June 30, 2018, The Company’s revenue from sales and services totals 457.47 MB, decreasing 42.89 MB or 8.57%, compared to the revenue from sales and services of 500.37 MB in the same period of previous year. The Company’s consolidate net profit attributable to equity holders of 24.55 MB, representing a net profit margin of 5.32%, increasing by 121.17 MB or 125.42%, compared to net loss attributable to equity holders of 96.61 MB in the same period of previous year.
Operating performance
Unit : MB
| Q2/2018 | Q2/2017 | % YoY | Q1/2018 | % QoQ | 6M/2018 | 6M/2017 | % YoY | |
|---|---|---|---|---|---|---|---|---|
| Revenue from sales | 209.27 | 221.47 | -5.51% | 221.04 | -5.32% | 430.32 | 435.55 | -1.20% |
| Revenue from rendering of services | 5.99 | 11.86 | -49.54% | 5.82 | 2.81% | 11.81 | 20.44 | -42.24% |
| Revenue from construction and service contracts | 3.81 | 18.81 | -79.73% | 11.54 | -66.96% | 15.35 | 44.37 | -65.41% |
| Other Revenue | 2.25 | 2.78 | -18.89% | 3.78 | -40.38% | 4.29 | 4.65 | -7.88% |
| Total Revenue | 221.32 | 254.92 | -13.18% | 242.18 | -8.61% | 461.76 | 505.02 | -8.57% |
| Cost of sales | 150.03 | 162.69 | -7.79% | 159.20 | -5.76% | 309.22 | 319.58 | -3.24% |
| Cost of rendering of services | 4.94 | 14.80 | -66.64% | 4.98 | -0.84% | 9.91 | 20.63 | -51.94% |
| Cost of construction and service contracts | 1.58 | 43.45 | -96.37% | 17.30 | -90.88% | 18.88 | 69.43 | -72.81% |
| Total Costs | 156.54 | 220.95 | -29.15% | 181.48 | -13.74% | 338.02 | 409.64 | -17.48% |
| Gross Profit | 62.53 | 31.20 | 100.43% | 56.92 | 9.86% | 119.46 | 90.73 | 31.66% |
| Gross Profit (%) | 28.54% | 12.37% | 23.88% | 26.11% | 18.13% | |||
| Total Selling & Administrative Expenses | 49.55 | 120.15 | -58.76% | 47.29 | 4.77% | 95.09 | 190.32 | -50.04% |
| Profit (Loss) before Finance Costs and Income Taxes Expense | 15.24 | (86.17) | 117.68% | 13.41 | 13.63% | 28.65 | (94.94) | 130.18% |
| Profit (Loss) before Finance Costs and Income Taxes Expense (%) | 6.89% | -33.80% | 5.54% | 24.34% | 6.20% | -18.80% | ||
| Profit (Loss) attributable to equity holders | 16.09 | (85.63) | 118.80% | 8.46 | 90.24% | 24.55 | (96.61) | 125.42% |
| Net Profit (Loss) (%) | 7.27% | -33.59% | 3.49% | 5.32% | -19.13% | |||
| Basic earnings per share (Baht) | 0.08 | (0.42) | 118.80% | 0.04 | 90.24% | 0.12 | (0.48) | 125.42% |
| Weighted average number of ordinary shares (Million shares) | 202.50 | 202.50 | 202.50 | 202.50 | 202.50 |
Revenue
Unit : MB
| Revenue structure | Q2/2018 | % | Q2/2017 | % | % YoY | Q1/2018 | % | % QoQ | M6/2018 | % | M6/2017 | % | % YoY |
|---|---|---|---|---|---|---|---|---|---|---|---|---|---|
| Occupational Safety, Health and Environment Products (SAFETY) | 169.83 | 78% | 185.55 | 74% | -8.47% | 183.52 | 77% | -7.46% | 353.35 | 77% | 369.07 | 74% | -4.26% |
| Control Environment Products (CE) | 42.57 | 19% | 38.94 | 15% | 9.32% | 39.70 | 17% | 7.24% | 82.27 | 18% | 76.00 | 15% | 8.25% |
| Water Solution Products (WATER) | 6.68 | 3% | 27.66 | 11% | -75.86% | 15.18 | 6% | -56.03% | 21.86 | 5% | 55.30 | 11% | -60.47% |
| Total revenue from sales and services | 219.07 | 100% | 252.15 | 100% | -13.12% | 238.40 | 100% | -8.11% | 457.47 | 100% | 500.37 | 100% | -8.57% |
In quarter 2/2018, the Company’s sales and services were 219.07 MB, comprise 209.27 MB of revenue from sales, 5.99 MB of revenue from services and 3.81 MB of revenue from construction contracts. Total revenue decreased by 33.07 MB or 13.12%, compared to 252.15 MB in the same quarter of previous year.
Revenue from Occupational Safety, Health and Environment Products or SAFETY was reported at 169.83 MB, decreasing by 15.72 MB or 8.47%, mainly due to lower sales from the government sector compared to the same quarter of previous year, affected by the enforcement of the new Procurement Act that has been effective from the end of 2017 onwards. With this, government institutions are in the process of getting ready to execute the new Act, leading to a smaller number of projects during the first half of 2018 compared to the first half of 2017.
The revenue from Control Environment Products or CE was reported at 42.57 MB, rising by 3.63 MB or 9.32% compared to the same quarter of previous year, due to the addition of new products for the existing customer base. Furthermore, there is a tendency for continuous growth for customers in the electronics industry sector.
Revenue from Water Solution Products or WATER was reported at 6.68 MB, reducing by 20.98 MB or 75.86% compared to the same quarter of previous year, due to lower revenue from the community water supply construction projects. There have been no new assignments from the government sector in 2018 so far, while the revenue generated has been realized from delivered portions of projects that are currently in execution.
Cost of Sales and Services
The Company’s total costs in quarter 2/2018 were 156.54 MB, comprising of 150.03 MB costs of sales, 4.94 MB cost of services and 1.58 MB cost of construction. Total costs decreased by 64.41 MB or 29.15% due to cost of sales decrease proportionally with revenue from sales and decreased from the Baht appreciation at the beginning of the year. Cost of service decrease proportionally with revenue from services. And cost of construction decreased proportionally with revenue recognized from construction contracting service and cost overrun for the construction projects was decrease.
In quarter 2/2018, costs of sales and services accounted for 71.46% of sales and services revenue. The Company’s gross profit was 62.53 MB, accounted for gross profit margin of 28.54%, which increase, compare with gross profit of 31.20 MB, accounted for gross profit margin of 12.37% in the same quarter of previous year.
Selling and Administrative Expenses
In quarter 2/2018, selling and administrative expenses were 49.55 MB comprised 22.31 MB of selling expenses and 28.33 MB of administrative expenses. Selling and administrative expenses were decrease by 70.60 MB or 58.76%, mainly due to the recorded 60.50 MB of allowance for doubtful debt for receivables for penalties arising from delays of construction in quarter 2/2017. In addition, in quarter 2/2018 the Company recorded 2.88 MB of reversal of penalties arising from delays of construction. For more efficiency, the selling and admin expenses were decreased, since the Company issues a policy to reduce unnecessarily costs, however the administration cost has been increased such as the legal action against a group of abandoned sub-contractor.
In quarter 2/2018, the company’s financial cost was 2.18 MB which decreased due to the decrease in loan from financial institution, compared with 3.34 MB of financial cost in the same quarter of previous year.
Net profit
In quarter 2/2018, the company’s consolidate net profit attributable to equity holders of the Company was 16.09 MB, accounted for net profit margin 7.27%, increasing by 101.72 MB or 118.80% compared to net loss of 85.63 MB in the same quarter of previous year.
Financial Position
Unit : MB
| June 30, 2018 | December 31, 2017 | % Change | |||
|---|---|---|---|---|---|
| Amount | % | Amount | % | ||
| Current Assets | 482.92 | 70.50% | 576.63 | 73.22% | -16.25% |
| Non-Current Assets | 202.12 | 29.50% | 210.85 | 26.78% | -4.14% |
| Total Assets | 685.04 | 100.00% | 787.48 | 100% | -13.01% |
| Current Liabilities | 360.14 | 52.47% | 484.34 | 61.40% | -25.64% |
| Non-Current Liabilities | 64.05 | 9.33% | 69.02 | 8.75% | -7.20% |
| Total Liabilities | 424.20 | 61.81% | 553.36 | 70.15% | -23.34% |
| Shareholder's Equity of the Company | 262.15 | 38.19% | 235.43 | 29.85% | 11.35% |
Assets
As of June 30, 2018, the Company’s total assets equaled 685.04 MB, decreasing by 102.44 MB or 13.01% from December 31, 2017. The decreased assets were mainly from current assets decreasing from 50 MB of unbilled receivables and prepaid expenses for the construction, 25.43 MB of cash and cash equivalents, 10.96 MB of net-inventories, 4.50 MB of trade and other current receivables and 3.17 MB of current tax assets. In addition, non-current assets were decrease, mainly from depreciation and amortization of the period.
Liabilities
As of June 30, 2018, the Company’s total liabilities equaled 424.20 MB, decreasing by 129.16 MB or 23.34% from December 31, 2017. The decreased liabilities were mainly due to the decreased of 93.29 MB in short-term loans from financial institution, 27.96 MB of trade payables and 2.36 MB of the recorded provision for expected loss on constructions contracts.
Shareholder's equity
As of June 30, 2018, Shareholders’ equity was 246.49 MB, increased from the resulting from net profit for the period of 24.55 MB.
Cash Flows
Unit : MB
| Cash Flows | June 30, 2018 | June 30, 2017 |
|---|---|---|
| Cashflow from (used in) operating activities | 80.08 | 50.28 |
| Cashflow from (used in) investing activities | (0.91) | (32.74) |
| Cashflow from (used in) financing activities | (104.46) | 18.49 |
| Net increase (decrease) in cash and cash equivalents | (25.30) | (0.95) |
| Cash and cash equivalents at the end of the period | 66.84 | 48.65 |
The Company’s net cash acquired from the operating activities was 80.08 MB, with operating profits prior to changes in the operating assets and liabilities of 42.17 MB and cash flow received from 50 MB of unbilled receivables and prepaid expenses for the construction. Trade and other receivables-net decreased 8.36 MB and net-inventories decreased 9.59 MB. While, cash flow used for trade and other payable of 30.88 MB.
Cash flow utilized in investment activities was 0.91 MB mainly used to purchase fix assets and intangible assets of 0.58 MB and 0.33 MB for loan to employees. While, cash flow from interest received of 0.43 MB.
Cash flow utilized in financing activities was 104.46 MB mainly used to repayment of loans from financial institutions of 96.86 MB and repayment of liabilities under lease agreement of 2.81 MB and interest expense of 0.43 MB.
Management Discussion & Analysis (MD&A) Quarter 3/2018
Overview
Phol Dhanya Public Company Limited (the Company) consolidated financial statement of the third quarter, ending September 30, 2018 reported the revenue from sales and service of 234.50 MB, decreasing by 17.43 MB or 6.92%, compared to the revenue from sales and services of 251.92 MB in the same quarter of previous year. The reduction has mainly been due to the fact that there have no new project of the community water supply. The revenue reported was realized from completed portions of projects in execution. Nevertheless, revenue from Occupational Safety, Health and Environment Products and Control Environment Products were increase and cost overrun for the community water supply construction projects was decrease, leading to gross profit of 58.97 MB in quarter 3/2018, increasing by 24.98 MB or 73.51%, compared to gross profit of 33.99 MB in the same quarter of previous year. In quarter 3/2018, selling and administrative expenses have increased, mainly because 3.99 MB of loss for impairment of asset. In quarter 3/2018, the Company’s profit before income tax was 6.32 MB increasing by 5.19 MB or 461.67% compared to profit before income tax of 1.13 MB in quarter 3/2017, however, the Company’s net profit attributable to equity holder was 5.09 MB in quarter 3/2018, decreasing by 7.08 MB or 58.17% compared to net profit attributable to equity holders of 12.18 MB due to income tax credit balance of 11.05 MB in quarter 3/2017.
For the nine months period of , ending September 30, 2018, The Company’s revenue from sales and services totals 691.97 MB, decreasing 60.32 MB or 8.02%, compared to the revenue from sales and services of 752.29 MB in the same period of previous year. The Company’s consolidate net profit attributable to equity holders of 29.65 MB, representing a net profit margin of 4.25%, compared to net loss attributable to equity holders of 84.44 MB in the same period of previous year.
Operating performance
Unit: Million baht
| Q3/2018 | Q3/2017 | % YoY | Q2/2018 | % QoQ | 9M/2018 | 9M/2017 | % YoY | |
|---|---|---|---|---|---|---|---|---|
| Revenue from sales | 226.40 | 213.56 | 6.01% | 209.27 | 8.18% | 656.71 | 649.12 | 1.17% |
| Revenue from rendering of services | 5.61 | 18.03 | -68.86% | 5.99 | -6.20% | 17.42 | 38.47 | -54.71% |
| Revenue from construction and service contracts | 2.49 | 20.33 | -87.78% | 3.81 | -34.80% | 17.83 | 64.70 | -72.44% |
| Other Revenue | 2.05 | 1.86 | 10.21% | 2.25 | -9.12% | 6.26 | 6.51 | -3.82% |
| Total Revenue | 236.54 | 253.78 | -6.79% | 221.32 | 6.88% | 698.23 | 758.80 | -7.98% |
| Cost of sales | 168.35 | 157.22 | 7.08% | 150.03 | 12.21% | 477.57 | 476.80 | 0.16% |
| Cost of rendering of services | 4.33 | 16.05 | -73.05% | 4.94 | -12.39% | 14.24 | 36.68 | -61.18% |
| Cost of construction and service contracts | 2.85 | 44.67 | -93.61% | 1.58 | 80.98% | 21.73 | 114.10 | -80.95% |
| Total Costs | 175.53 | 217.94 | -19.46% | 156.54 | 12.13% | 513.55 | 627.58 | -18.17% |
| Gross Profit | 58.97 | 33.99 | 73.51% | 62.53 | -5.70% | 178.42 | 124.71 | 43.07% |
| Gross Profit (%) | 25.15% | 13.49% | 28.54% | 25.78% | 16.58% | |||
| Total Selling & Administrative Expenses | 53.28 | 48.19 | 10.56% | 52.44 | 1.60% | 150.33 | 222.02 | -32.29% |
| Reversal penalties arising from delays of constructions | 0.30 | 16.64 | -98.17% | 2.90 | -89.50% | 2.33 | - | - |
| Profit (Loss) before Finance Costs and Income Taxes Expense | 8.04 | 4.14 | 94.12% | 15.24 | -47.27% | 36.69 | (90.80) | 140.40% |
| Profit (Loss) before Finance Costs and Income Taxes Expense (%) | 3.40% | 1.63% | 6.89% | 5.25% | -11.97% | |||
| Profit (Loss) attributable to equity holders | 5.09 | 12.18 | -58.17% | 16.09 | -68.36% | 29.65 | (84.44) | 135.11% |
| Net Profit (Loss) (%) | 2.15% | 4.80% | 7.27% | 4.25% | -11.13% | |||
| Basic earnings per share (Baht) | 0.03 | 0.06 | -58.17% | 0.08 | -68.36% | 0.15 | (0.42) | 135.11% |
| Weighted average number of ordinary shares (Million shares) | 202.50 | 202.50 | 202.50 | 202.50 | 202.50 |
Revenue
Unit: Million baht
| Revenue structure | Q3/2018 | % | Q3/2017 | % | % YoY | Q2/2018 | % | % QoQ | 9M/2018 | % | 9m/2017 | % | % YoY |
|---|---|---|---|---|---|---|---|---|---|---|---|---|---|
| Occupational Safety, Health and Environment Products (SAFETY) | 180.15 | 77% | 174.99 | 69% | 2.95% | 169.83 | 78% | 6.08% | 533.50 | 77% | 544.06 | 72% | -1.94% |
| Control Environment Products (CE) | 44.99 | 19% | 43.74 | 17% | 2.86% | 42.57 | 19% | 5.68% | 127.26 | 18% | 119.74 | 16% | 6.28% |
| Water Solution Products (WATER) | 9.36 | 4% | 33.19 | 13% | -71.79% | 6.68 | 3% | 40.26% | 31.22 | 5% | 88.49 | 12% | -64.71% |
| Total revenue from sales and services | 234.50 | 100% | 251.92 | 100% | -6.91% | 219.07 | 100% | 7.04% | 691.98 | 100% | 752.29 | 100% | -8.02% |
In quarter 3/2018, the Company’s sales and services were 234.50 MB, comprise 226.40 MB of revenue from sales, 5.61 MB of revenue from services and 2.49 MB of revenue from construction contracts.
Revenue from Occupational Safety, Health and Environment Products or SAFETY was reported at 180.15 MB, increasing by 5.16 MB or 2.95% compared to the same quarter of previous year, Revenue from existing customers were increase and revenues from new customers have slightly increased. However, Revenue from rendering of services decreased due to the decreased in revenue from services of installation of lifeline safety products in the quarter 3/2018.
The revenue from Control Environment Products or CE was reported at 44.99 MB, rising by 1.25 MB or 2.86% compared to the same quarter of previous year, due to the addition of new products for the existing customer base. Furthermore, the electronics industry sector customers were continuous growth.
Revenue from Water Solution Products or WATER was reported at 9.36 MB, reducing by 23.83 MB or 71.79% compared to the same quarter of previous year, due to lower revenue from the community water supply construction projects. There have been no new assignments from the government sector in 2018 so far, while the revenue generated has been realized from delivered portions of projects that are currently in execution. Furthermore, in quarter 3/2018, revenue from industrial project sector and drilling ground water were decrease compare to the same quarter of previous year.
Cost of Sales and Services
The Company’s total costs in quarter 3/2018 were 175.53 MB, comprising of 168.35 MB costs of sales, 4.33 MB cost of services and 2.85 MB cost of construction. Total costs decreased by 42.41 MB or 19.46%, cost of sales increase proportionally with revenue from sales. Cost of service decrease proportionally with revenue from services and cost of construction decreased proportionally with revenue recognized from construction contracting service and cost overrun for the construction projects was decrease. The result for costs of sales and services accounted for 74.85% of sales and services revenue. The Company’s gross profit was 58.97 MB, accounted for gross profit margin of 25.15%, which increase, compare with gross profit of 33.99 MB, accounted for gross profit margin of 13.49% in the same quarter of previous year.
Selling and Administrative Expenses
In quarter 3/2018, selling and administrative expenses were 53.28 MB comprised 21.15 MB of selling expenses and 32.14 MB of administrative expenses. Selling and administrative expenses were decreased according to cost effective management expenses policy, however, some of expenses has been increased such as sales commission were increase according to revenue from sales and the legal fee of abandoned sub-contractor. Administrative expenses included 3.99 MB of allowance for impairment of asset of water treatment project which evaluation cost of the project compare with return on investment.
In quarter 3/2018, the company’s financial cost was 1.72 MB which decreased due to the decrease in loan from financial institution, compared with 3.04 MB of financial cost in the same quarter of previous year.
Net profit
In quarter 3/2018, the Company’s profit before income tax was 6.32 MB increasing by 5.19 MB or 461.67% compared to profit before income tax of 1.13 MB in quarter 3/2017, however, the Company’s net profit attributable to equity holder was 5.09 MB in quarter 3/2018, decreasing by 7.08 MB or 58.17% compared to net profit attributable to equity holders of 12.18 MB due to income tax credit balance of 11.05 MB from deferred tax assets in quarter 3/2017.
Financial Position
Unit: Million baht
| September 30, 2018 | December 31, 2017 | % Change | |||
|---|---|---|---|---|---|
| Amount | % | Amount | % | ||
| Current Assets | 472.03 | 70.70% | 576.63 | 73.22% | -18.14% |
| Non-Current Assets | 195.64 | 29.30% | 210.85 | 26.78% | -7.21% |
| Total Assets | 667.67 | 100.00% | 787.48 | 100% | -15.22% |
| Current Liabilities | 345.13 | 51.69% | 484.34 | 61.40% | -28.74% |
| Non-Current Liabilities | 56.42 | 8.45% | 69.02 | 8.75% | -18.26% |
| Total Liabilities | 401.54 | 60.02% | 553.36 | 70.15% | -27.43% |
| Shareholder's Equity of the Company | 267.42 | 39.38% | 235.43 | 29.85% | 13.59% |
Assets
As of September 30, 2018, the Company’s total assets equaled 667.67 MB, decreasing by 119.82 MB or 15.22% from December 31, 2017. The decreased assets were mainly from current assets decreasing from 55.59 MB of unbilled receivables and prepaid expenses for the construction, 26.26 MB of cash and cash equivalents, 15.73 MB of net-inventories, 3.45 MB of trade and other current receivables and 3.89 MB of current tax assets. In addition, non-current assets were decrease, mainly from 14.99 MB of depreciation and amortization of the period and 3.99 MB of Allowance for impairment of assets, while, deferred tax assets increased by 2.16 MB.
Liabilities
As of September 30, 2018, the Company’s total liabilities equaled 401.54 MB, decreasing by 151.81 MB or 27.43% from December 31, 2017. The decreased liabilities were mainly due to the decreased of 123.91 MB in short-term loans from financial institution, 15.02 MB of trade and other payables and 1.91 MB of the recorded provision for expected loss on constructions contracts, however, accrued income tax increased by 1.81 MB.
Shareholder’s equity
As of September 30, 2018, Shareholders’ equity was 267.42 MB, increased from the resulting from net profit for the period of 29.65 MB.
Cash Flows
Unit: Million Baht
| Cash Flows | September 30, 2018 | September 30, 2017 |
|---|---|---|
| Cashflow from (used in) operating activities | 114.81 | 87.56 |
| Cashflow from (used in) investing activities | (1.30) | (32.22) |
| Cashflow from (used in) financing activities | (139.82) | (62.35) |
| Net increase (decrease) in cash and cash equivalents | (26.31) | (7.01) |
| Cash and cash equivalents at the end of the period | 66.01 | 42.32 |
The Company’s net cash acquired from the operating activities was 114.81 MB, with operating profits prior to changes in the operating assets and liabilities of 59.87 MB and cash flow received from 55.59 MB of unbilled receivables and prepaid expenses for the construction. Trade and other receivables-net decreased 3.65 MB and net-inventories decreased 13.26 MB. While, cash flow used for trade and other payable of 16.19 MB.
Cash flow utilized in investment activities was 1.30 MB mainly used to purchase fix assets and intangible assets of 1.36 MB and 0.51 MB for loan to employees. While, cash flow from interest received of 0.65 MB.
Cash flow utilized in financing activities was 139.82 MB mainly used to repayment of loans from financial institutions of 129.26 MB and repayment of liabilities under lease agreement of 4.02 MB and interest expense of 6.54 MB.
Management Discussion & Analysis (MD&A) Yearly 2018
Overview
Phol Dhanya Public Company Limited (the Company) consolidated financial statement of the year, ending December 31, 2018 reported the revenue from sales and service of 924.45 MB, decreasing by 61.39 MB or 6.23%, compared to the revenue from sales and services of 985.84 MB in previous year. The reduction has mainly been due to the fact that there have no new project of the community water supply. The revenue reported was realized from completed portions of projects in execution. Nevertheless, revenue from Occupational Safety, Health and Environment Products and Control Environment Products were increase. Total casts were decrease due to cost overrun for the community water supply construction projects was decrease by 87.66 MB compare to previous year, leading to gross profit of 227.62 MB in 2018, increasing by 88.34 MB or 63.42%, compared to gross profit of 139.28 MB in the previous year. In addition, selling and administrative expenses have decreased. The results in net profit attributable to equity holders of 36.51 MB in 2018, accounted for net profit margin of 3.91%, increased from the previous year with net loss attributable to equity holders of 117.85 MB.
Operating performance
Unit: Million baht
| 2018 | 2017 | % YoY | |
|---|---|---|---|
| Revenue from sales | 882.21 | 863.37 | 2.18% |
| Revenue from rendering of services | 25.35 | 44.70 | -43.28% |
| Revenue from construction and service contracts | 16.89 | 77.77 | -78.28% |
| Other Revenue | 9.35 | 8.83 | 5.79% |
| Total Revenue | 933.80 | 994.68 | -6.12% |
| Cost of sales | 651.68 | 631.44 | 3.21% |
| Cost of rendering of services | 21.74 | 43.16 | -49.63% |
| Cost of construction and service contracts | 23.42 | 171.96 | -86.38% |
| Total Costs | 696.84 | 846.56 | -17.69% |
| Gross Profit | 227.62 | 139.28 | 63.42% |
| Gross Profit (%) | 24.62% | 14.13% | |
| Total Selling & Administrative Expenses | 192.74 | 269.82 | -28.57% |
| Reversal penalties arising from delays of constructions | 2.67 | - | |
| Profit (Loss) before Finance Costs and Income Taxes Expense | 46.90 | (121.71) | 138.53% |
| Profit (Loss) before Finance Costs and Income Taxes Expense (%) | 5.02% | -12.24% | |
| Profit (Loss) attributable to equity holders | 36.51 | (117.48) | 131.08% |
| Net Profit (Loss) (%) | 3.91% | -11.81% | |
| Basic earnings per share (Baht) | 0.18 | (0.58) | 131.08% |
| Weighted average number of ordinary shares (Million shares) | 202.50 | 202.50 |
Revenue
Unit: Million baht
| 2018 | % | 2017 | % | % YoY | |
|---|---|---|---|---|---|
| Occupational Safety, Health and Environment Products (SAFETY) | 715.73 | 77.42% | 715.18 | 72.54% | 0.08% |
| Control Environment Products (CE) | 172.57 | 18.67% | 163.84 | 16.62% | 5.33% |
| Water Solution Products (WATER) | 36.16 | 3.91% | 106.83 | 10.84% | -66.15% |
| Total revenue from sales and services | 924.45 | 100% | 985.84 | 100% | -6.23% |
In 2018, the Company’s sales and services were 924.45 MB, comprise 882.21 MB of revenue from sales, 25.35 MB of revenue from services and 16.89 MB of revenue from construction contracts.
Revenue from Occupational Safety, Health and Environment Products or SAFETY was reported at 715.73 MB, similar to the previous year. Revenue from existing customers in industrial sector were increase, however, revenues from new customers have slightly increased and revenue from sales in government sector customers were decrease, affected by the enforcement of the new Procurement Act, with this, government institutions are in the process of getting ready to execute the new Act in the first half of the year, leading to a smaller number of projects compared to the previous year. Revenue from rendering of services from services of installation of safety products which decreased compared to the previous year.
The revenue from Control Environment Products or CE was reported at 172.57 MB, rising by 8.73 MB or 5.33% compared to the previous year, due to the addition of new products for the existing customer base. Furthermore, the electronics industry sector customers were continuous growth.
Revenue from Water Solution Products or WATER was reported at 36.16 MB, reducing by 70.67 MB or 66.15% compared to the previous year, due to lower revenue from the community water supply construction projects. There have been no new assignments from the government sector in 2018 so far, while the revenue generated has been realized from delivered portions of projects that are currently in execution, furthermore, revenue from drilling ground water were decrease. However, revenue from sales and services in industrial project sector were increase compare to the previous year.
Cost of Sales and Services
The Company’s total costs in 2018 were 696.84 MB, comprising of 651.68 MB costs of sales, 21.74 MB cost of services and 23.42 MB cost of construction. Total costs decreased by 149.42 MB or 17.69%, cost of sales increase proportionally with revenue from sales. Cost of service decrease proportionally with revenue from services and cost of construction decreased proportionally with revenue recognized from construction contracting service and cost overrun for the construction projects was decrease. The result for costs of sales and services accounted for 75.38% of revenue from sales and services. The Company’s gross profit was 227.62 MB, accounted for gross profit margin of 24.62%, which increase, compare with gross profit of 139.28 MB, accounted for gross profit margin of 14.13% in the previous year.
Selling and Administrative Expenses
In 2018, selling and administrative expenses were 192.74 MB comprised 85.38 MB of selling expenses and 104.85 MB of administrative expenses. Selling and administrative expenses decreased by 77.09 MB or 28.57%, mainly due to the recorded 60.50 MB of allowance for doubtful debt for receivables for penalties arising from delays of construction and recorded 10 MB of allowance for impairment of assets for drilling machines in previous year. And in 2018, penalties arising from delays of constructions were decrease; the Company recorded 2.67 MB of reversal of penalties arising from delays of construction. In addition, selling and administrative expenses were decreased according to effective management expenses policy, however, some of expenses has been increased such as sales commission were increase according to revenue from sales and the legal fee of abandoned sub-contractor and the recorded of 2.51 MB of allowance for impairment of asset of water treatment project which evaluation cost of the project compare with return on investment.
In 2018, the company’s financial cost was 8.17 MB which decreased due to the decrease in loan from financial institution, compared with 13.27 MB of financial cost of previous year.
Net profit
In 2018, the Company’s net profit attributable to equity holder was 36.51 MB, representing net profit margin of 3.91% which increased compared to net loss attributable to equity holders of 117.48 MB of previous year.
Financial Position
Unit: Million baht
| December 31, 2018 | December 31, 2017 | % Change | |||
|---|---|---|---|---|---|
| Amount | % | Amount | % | ||
| Current Assets | 457.87 | 70.21% | 576.63 | 73.22% | -20.60% |
| Non-Current Assets | 194.24 | 29.79% | 210.85 | 26.78% | -7.88% |
| Total Assets | 652.12 | 100% | 787.48 | 100% | -17.19% |
| Current Liabilities | 325.30 | 49.78% | 484.34 | 61.40% | -32.84% |
| Non-Current Liabilities | 53.83 | 8.24% | 69.02 | 8.75% | -22.00% |
| Total Liabilities | 379.14 | 58.02% | 553.36 | 70.15% | -31.48% |
| Shareholder's Equity of the Company | 457.87 | 70.21% | 576.63 | 73.22% | -20.60% |
Assets
As of December 31, 2018, the Company’s total assets equaled 652.12 MB, decreasing by 135.37 MB or 17.19% from December 31, 2017. The decreased assets were mainly from current assets decreasing from 56.64 MB of unbilled receivables and prepaid expenses for the construction, 35.06 MB of cash and cash equivalents, 17.27 MB of netinventories, 5.94 MB of trade and other current receivables and 4.05 MB of current tax assets. In addition, non-current assets were decrease, mainly from 18.71 MB of depreciation and amortization of the period and 2.51 MB of allowance for impairment of assets, while, deferred tax assets increased by 3.28 MB.
Liabilities
As of December 31, 2018, the Company’s total liabilities equaled 379.14 MB, decreasing by 174.22 MB or 31.48% from December 31, 2017. The decreased liabilities were mainly due to the decreased of 152.39 MB in short-term loans from financial institution, 8.23 MB of trade and other payables and 2.29 MB of the recorded provision for expected loss on constructions contracts, however, accrued income tax increased by 4.15 MB.
Shareholder’s equity
As of December 31, 2018, Shareholders’ equity was 274.28 MB, increased from the resulting from net profit for the period of 36.51 MB.
Cash Flows
Unit: Million Baht
| Cash Flows | December 31, 2018 | December 31, 2017 |
|---|---|---|
| Cashflow from (used in) operating activities | 139.15 | 132.73 |
| Cashflow from (used in) investing activities | (1.28) | (31.23) |
| Cashflow from (used in) financing activities | (172.97) | (56.63) |
| Net increase (decrease) in cash and cash equivalents | (35.10) | 42.87 |
| Cash and cash equivalents at the end of the period | 57.12 | 92.27 |
The Company’s net cash acquired from the operating activities was 139.15 MB, with operating profits prior to changes in the operating assets and liabilities of 79.55 MB and cash flow received from 56.64 MB of unbilled receivables and prepaid expenses for the construction. Trade and other receivables-net decreased 6.02 MB and net-inventories decreased 6.73 MB. While, cash flow used for trade and other payable of 7.87 MB.
Cash flow utilized in investment activities was 1.28 MB mainly used to purchase fix assets and intangible assets of 1.50 MB. While, cash flow from loan to employees of 0.44 MB and interest received of 0.65 MB.
Cash flow utilized in financing activities was 172.97 MB mainly used to repayment of loans from financial institutions of 159.93 MB and repayment of liabilities under lease agreement of 5.27 MB and interest expense of 8.17 MB.
Management Discussion & Analysis (MD&A) Quarter 1/2017
Overview
In its consolidated financial statements as of March 31, 2017, Phol Dhanya Pubic Company Limited (The Company)
recorded revenue from sales and services of 248.22 MB, decreasing 20.50 MB or 7.63% compared to the revenue from
sales and services of 268.72 MB in the same quarter of previous year. Revenue from sales and services of Occupational
Safety, Health and Environment Products (SAFETY) and Control Environment Products (CE) were increase, however,
Water Solution Products (WATER) recorded revenue recognized from construction contracting service of the community
water supply projects decreased compared with the same quarter of previous year. In addition, the delayed completion of
the construction continuously from quarter 4/2016, in Quarter 1/2017, the company estimated liabilities arising from the
delay of this project for 116.25 MB, 94.27 MB of which was reclaimable from the contractors. The Company assessed its
ability to reclaim the penalties from the sub-contractors and estimated provisions, expected cannot reclaim such penalties
from the sub-contractors, also consequently recorded liabilities from expected penalties of delayed project delivery to
increase of 22.03 MB. These results in net loss attributable to equity holders of 10.99 MB in Quarter 1/2017, decreasing
by 20.95 MB or 210.29% compared to net profit attributable to equity holders of 9.96 in Quarter 1/2016.
Operating performance
Unit: Million baht
| 1Q2017 | 1Q2016 | % YoY | |
|---|---|---|---|
| Revenue from sales | 214.08 | 203.47 | 5.22% |
| Revenue from rendering of services | 8.58 | 7.74 | 10.83% |
| Revenue from construction and service contracts | 25.56 | 57.51 | -55.56% |
| Other Revenue | 1.88 | 0.47 | 303.89% |
| Total Revenue | 250.10 | 269.19 | -7.09% |
| Cost of sales | 156.89 | 151.77 | 3.37% |
| Cost of redering of services | 5.83 | 8.14 | -28.33% |
| Cost of construction and service contracts | 25.98 | 48.42 | -46.36% |
| Total Costs | 188.69 | 208.33 | -9.42% |
| Gross Profit | 59.53 | 60.40 | -1.44% |
| Gross Profit (%) | 26.74% | 28.60% | 0.00% |
| Total Selling & Administrative Expenses | 70.17 | 46.22 | 51.82% |
| Profit (Loss) before Finance Costs and Income Taxes Expense | -8.77 | 14.64 | -159.87% |
| Profit (Loss) before Finance Costs and Income Taxes Expense (%) | -3.51% | 5.44% | 0.00% |
| Profit (Loss) attributable to equity holders | -10.99 | 9.96 | -210.29% |
| Net Profit (%) | -4.39% | 3.70% | 0.00% |
| Basic ernings per share (Baht) | -0.05 | 0.06 | -188.23% |
| Weighted average number of ordinary shares (Million shares) | 202.50 | 162.00 | 0.00 |
Revenue
Unit: Million Baht
| Revenue structure | 1Q2017 | % | 1Q2016 | % | %YoY |
|---|---|---|---|---|---|
| Ocupational Safety, Health and Environment Products (SAFETY) | 37.06 | 73.93% | 171.96 | 63.99% | 6.72% |
| Control Environment Products (CE) | 30.07 | 14.93% | 30.07 | 11.19% | 23.26% |
| Water Treatment Products (WATER) | 27.64 | 11.13% | 66.69 | 24.82% | -58.56% |
| Total revenue from sales and services | 248.22 | 100% | 268.72 | 100% | -7.63% |
In Quarter 1/2017, the Company’s sales and services were 248.22 MB, comprise 214.08 MB of revenue from
sales, 8.58 MB of revenue from services and 25.56 MB of revenue from construction contracts. Total revenue decreased
by 20.50 MB or 7.63%, compared with 268.72 MB in the same quarter of previous year.
Revenue from Occupational Safety, Health and Environment Products or SAFETY was 183.52 MB, which has
increased by 11.56 MB or 6.72% YoY compared to the same quarter of previous year, mainly due to the revenue from
sales and services of technical products and revenue from sales in government sector customers were increased.
The revenue earned from Control Environment Products or CE amounts to 37.06 MB, increasing by 6.99 MB or
23.26% compared with the same quarter of previous year. Major customers are in the electronics industry. In quarter
1/2017, the overview of electronics industry has been growth compare with the same quarter of previous year, the
company aimed at optimizing cost to retain existing customers and provide identifying competitive products to increase
revenue from the CE Products.
Revenue from Water Treatment Products or WATER equals 27.64 MB, decreasing by 39.05 MB or 58.56%
YoY, compared with the same quarter of previous year, due to revenue recognized from construction contracting service
of the community water supply project was decreased.
Cost of Sales and Services
The Company’s cost of sales and services in Quarter 1/2017 were 188.39 MB, comprising of 156.89 MB cost of
sales and 5.83 MB cost of services and 25.98 MB cost of construction. Cost of sales increased proportionally with more
revenue from sales. Cost of construction decreased proportionally with revenue recognized from construction
contracting service. In quarter 1/2017, Costs of sales and services account for 73.26% of sales and service revenue. Gross
profit margin from sales and services were increased, however, gross profit of the construction contracting service for the
community water supply project had incremental cost to rush the project completion, leading to a gross profit of 26.74%
which decrease, compare with 28.60% of the same quarter of previous year.
Selling and Administrative Expenses
In Quarter 1/2017, selling and administrative expenses amounted to 70.17 MB comprised of selling expenses
amounted to 23.10 MB and administrative expenses amounted to 25.04 MB. Administrative expenses were increase due
to the increase in number of personnel and recorded 22.03 MB of liabilities from expected penalties arising from delays
of constructions which cannot collect from sub-contractors.
In Quarter 1/2017, the company’s financial cost amounted to 3.98 MB, increasing due to the increase in loan
from financial institution for working capital.
Net profit
The effects from estimated liabilities from expected penalties arising from delays projects, the company’s
consolidate net loss (attributable to equity holders of the Company) was 10.99 MB, accounted for net loss margin 4.39%
Financial Position
Unit: Million baht
| March 31, 2017 | December 31, 2017 | % Change | |||
|---|---|---|---|---|---|
| Amount | % | Amount | % | ||
| Current Assets | 909.66 | 80.20% | 770.07 | 80.14% | 18.13% |
| Non-Current Assets | 224.55 | 19.80% | 190.88 | 19.86% | 17.64% |
| Current Liabilities | 718.64 | 63.36% | 534.12 | 55.51% | 34.54% |
| Non-Current Liabilities | 75.31 | 6.64% | 75.82 | 7.88% | -0.68% |
| Shareholder's Equity of the Company | 341.57 | 30.11% | 352.31 | 36.61% | -3.05% |
Assets
As of March 31, 2017, the Company’s total assets equaled 1,134.21 MB, increasing by 173.26 MB or 18.03%
from December 31, 2016. The increased assets were mainly from current assets increasing from 88.40 MB of cash and
cash equivalents, 18.96 MB of trade receivables and 65.07 of receivables for penalties arising from delays of
constructions. While, unbilled receivables and prepaid expenses to the subcontractors for the construction decreased of
147.86 MB. Non-current assets amount to 224.55 MB, mainly increase from 30 MB of restricted deposits with financial
institution for short-term loan facility.
Liabilities
As of March 31, 2017, the Company’s total liabilities equaled 793.95 MB, increasing by 184 MB or 30.17%
from December 31, 2016. The major source of liabilities is short-term loans from financial institution of 135.90 MB and
recorded provision for penalties arising from delays of constructions and provision for expected loss on constructions
contracts amount to 23.60 MB. Non-current liabilities most likely to the same quarter of previous year.
Shareholder’s equity
As of March 31, 2017, Shareholders’ equity was 341.57 MB, retained earnings was decrease due to the
resulting from net loss was 10.99 MB.
Cash Flows
Unit: Million Baht
| Cash Flows | March 31, 2017 | March 31, 2016 |
|---|---|---|
| Cashflow from (used in) operating activities | (7.20) | (68.89) |
| Cashflow from (used in) investing activities | (31.85) | (1.71) |
| Cashflow from (used in) financing activities | 127.19 | 49.85 |
| Net increase (decrease) in cash and cash equivalents | 88.14 | (20.75) |
| Cash and cash equivalents at the end of the period | 137.25 | 38.48 |
The Company’s net cash utilized in the operating activities is 7.20 MB, with operating profits prior to changes
in the operating assets and liabilities of 21.82 MB. The major reason for the change is due to the trade and other
receivables increased 93.05 MB, while unbilled receivables and prepaid expenses to the subcontractors for the
construction decreased of 46.68 MB and trade and other payable were increased of 23.52 MB.
Cash flow utilized in investment activities amounts to 31.85 MB mainly increase from 30 MB of restricted
deposits with financial institution for short-term loan facility and 1.82 MB was used to purchase fix assets.
Cash flow acquired from financing activities amounts to 127.19 MB; short-term loans from financial
institutions have increased by 134.85 MB, while loan repayment to financial institutions amounts to 3.29 MB and debt
settlement according to financial lease of 1.68 MB was arranged, with an interest expense of 2.69 MB.
Management Discussion & Analysis (MD&A) Quarter 2/2017
Overview
In its consolidated financial statements as of June 30, 2017, Phol Dhanya Pubic Company Limited (The Company) recorded revenue from sales and services of 252.15 MB, decreasing 51.47 MB or 16.95% compared to the revenue from sales and services of 303.61 MB in the same quarter of previous year. Revenue from sales and services of Occupational Safety, Health and Environment Products (SAFETY) and Control Environment Products (CE) were increase, however, Water Solution Products (WATER) recorded revenue recognized from construction contracting service of the community water supply projects decreased compared with the same quarter of previous year. And the cause of delayed completion of the construction continuously, in quarter 2/2017, the company estimated liabilities arising from the delay of this projects for 137.81 MB, 113.05 MB of which was reclaimable from the contractors. In quarter 2/2017, the Company has already taken the legal action against the sub-contractor to claim for the penalties arising from construction delay. In accordance with the conservative principle, the Company records the penalties arising from construction delay incurred in 2017 in cost of construction. And fully provide provision for doubtful debt for receivables for penalties arising from delays of construction of 60.50 MB. These results in net loss attributable to equity holders of 85.63 MB in Quarter 2/2017, decreasing by 99.22 MB or 730.19% compared to net profit attributable to equity holders of 13.59 in Quarter 2/2016.
For the six months period of 2017, The Company’s revenue from sales and services totals 500.37 MB, decreasing 71.97 MB or 12.57%, compared to the revenue from sales and services of 572.34 MB in the same period of previous year. The Company’s consolidate net loss attributable to equity holders of 96.61 MB, decreasing 120.16 MB or 510.284%, compared to net profit attributable to equity holders of 23.55 MB in the same period of previous year.
Operating performance
Unit: Million baht
| Quarter | 6 Months | |||||
|---|---|---|---|---|---|---|
| 2Q2017 | 2Q2016 | % YoY | Y2017 | Y2016 | % YoY | |
| Revenue from sales | 221.47 | 194.25 | 14.02% | 435.55 | 397.71 | 9.51% |
| Revenue from rendering of services | 11.86 | 3.26 | 263.71% | 20.44 | 11.00 | 85.78% |
| Revenue from construction and service contracts | 18.81 | 106.11 | -82.27% | 44.37 | 163.62 | -72.88% |
| Other Revenue | 2.78 | 1.47 | 88.41% | 4.65 | 1.94 | 140.11% |
| Total Revenue | 254.92 | 305.09 | -16.44% | 505.02 | 574.28 | -12.06% |
| Cost of sales | 162.69 | 144.63 | 12.49% | 319.58 | 296.40 | 7.82% |
| Cost of rendering of services | 14.80 | 0.85 | 1,636.27% | 20.63 | 8.99 | 129.52% |
| Cost of construction and service contracts | 43.45 | 94.09 | -53.82% | 69.43 | 142.51 | -51.28% |
| Total Costs | 220.95 | 239.58 | -7.78% | 409.64 | 447.90 | -8.54% |
| Gross Profit | 31.20 | 64.04 | -51.28% | 90.73 | 124.44 | -27.09% |
| Gross Profit (%) | 12.37% | 21.09% | 18.13% | 21.74% | ||
| Total Selling & Administrative Expenses | 120.15 | 45.95 | 161.45% | 190.32 | 92.18 | 106.48% |
| Profit (Loss) before Finance Costs and Income Taxes Expense | (86.17) | 19.56 | -540.59% | (94.94) | 34.20 | -377.60% |
| Profit (Loss) before Finance Costs and Income Taxes Expense (%) | -33.80% | 6.41% | -18.80% | 5.96% | ||
| Profit (Loss) attributable to equity holders | (85.63) | 13.59 | -730.19% | (96.61) | 23.55 | -510.28% |
| Net Profit (Loss) (%) | -33.59% | 4.45% | -19.13% | 4.10% | ||
| Basic earnings per share (Baht) | (0.42) | 0.08 | -604.15% | (0.48) | 0.15 | -428.22% |
| Weighted average number of ordinary shares (Million shares) | 202.50 | 162.00 | 202.50 | 162.00 | ||
Revenue
Unit: Million Baht
| Revenue structure | Quarter | 6 Months | |||||||||||
|---|---|---|---|---|---|---|---|---|---|---|---|---|---|
| 2Q2017 | % | 2Q2016 | % | % YoY | 1Q2017 | % | %QoQ | Y2017 | % | Y2016 | % | %YoY | |
| Occupational Safety, Health and Environment Products (SAFETY) | 185.55 | 74% | 165.88 | 55% | 11.86% | 183.52 | 74% | 1.10% | 369.07 | 74% | 337.84 | 59% | 9.24% |
| Control Environment Products (CE) | 38.94 | 15% | 29.51 | 10% | 31.96% | 37.06 | 15% | 5.06% | 76.00 | 15% | 59.58 | 10% | 27.57% |
| Water Solution Products (WATER) | 27.66 | 11% | 108.22 | 36% | -74.44% | 27.64 | 11% | 0.08% | 55.30 | 11% | 174.92 | 31% | -68.39% |
| Total revenue from sales and services | 252.15 | 100% | 303.61 | 100% | -16.95% | 248.22 | 100% | 1.58% | 500.37 | 100% | 572.34 | 100% | -12.57% |
In Quarter 2/2017, the Company’s sales and services were 252.15 MB, comprise 221.47 MB of revenue from sales, 11.86 MB of revenue from services and 18.81 MB of revenue from construction contracts. Total revenue decreased by 51.47 MB or 16.95%, compared with 303.61 MB in the same quarter of previous year.
Revenue from Occupational Safety, Health and Environment Products or SAFETY was 185.55 MB, which has increased by 19.67 MB or 11.86% YoY compared to the same quarter of previous year, mainly due to the revenue from sales and services of technical products and expansion of sales areas, revenue from new customers were increase. In addition, revenue from sales in government sector customers were increased.
Revenue earned from Control Environment Products or CE was 38.94 MB, increasing by 9.43 MB or 31.96% compared with the same quarter of previous year. Major customers are in the electronics industry, the overview of electronics industry has been growth due to manufacturers can adapt to changing technology. Revenue from Control Environment Products were increase.
Revenue from Water Solution Products or WATER equals 27.66 MB, decreasing by 80.56 MB or 74.44% YoY, compared with the same quarter of previous year, due to revenue recognized from construction contracting service of the community water supply project was decreased.
Cost of Sales and Services
The Company’s cost of sales and services in Quarter 2/2017 were 220.95 MB, comprising of 162.69 MB cost of sales and 14.80 MB cost of services and 43.45 MB cost of construction. Cost of sales increased proportionally with more revenue from sales. Cost of services increased proportionally with more revenue from services and depreciation cost for services. Cost of construction decreased proportionally with revenue recognized from construction contracting service. However, cost of construction was high than revenue due to the extra cost to rush the project completion and records the penalties arising from construction delay in cost of construction. In quarter 2/2017, The Company’s gross profit of 12.37% which decrease, compare with 21.09% of the same quarter of previous year.
Selling and Administrative Expenses
In Quarter 2/2017, selling and administrative expenses amounted to 120.15 MB comprising of 23.84 MB selling expenses and 92.32 MB administrative expenses. Administrative expenses were increase due to the increase in number of personnel and recorded 60.50 MB of allowance for doubtful debt for receivables for penalties arising from delays of construction.
In Quarter 2/2017, the company’s financial cost amounted to 3.34 MB, increasing due to the increase in loan from financial institution for working capital.
Net profit
The effects from from expected penalties arising from delays projects and allowance for doubtful debt for receivables for penalties arising from delays of construction, the company’s consolidate net loss (attributable to equity holders of the Company) was 85.63 MB, accounted for net loss margin 33.59%
Financial Position
Unit: Million baht
| June 30, 2017 | December 31, 2016 | % Change | |||
|---|---|---|---|---|---|
| Amount | % | Amount | % | ||
| Current Assets | 615.74 | 54.29% | 770.07 | 80.14% | -20.04% |
| Non-Current Assets | 222.07 | 19.58% | 190.88 | 19.86% | 16.34% |
| Current Liabilities | 509.66 | 44.94% | 534.12 | 55.51% | -4.58% |
| Non-Current Liabilities | 73.41 | 6.47% | 75.82 | 7.88% | -3.18% |
| Shareholder's Equity of the Company | 256.04 | 22.57% | 352.31 | 36.61% | -27.32% |
Assets
As of June 30, 2017, the Company’s total assets equaled 837.81 MB, decreasing by 123.14 MB or 12.81% from December 31, 2016. The decreased assets were mainly from current assets decreasing from 127.83 MB of other receivables from allowance for doubtful debt for receivables for penalties arising from delays of construction. And unbilled receivables and prepaid expenses to the subcontractors for the construction decreased of 77.28 MB. Non-current assets amount to 222.07 MB, mainly increase from 30 MB of restricted deposits with financial institution for short-term loan facility.
Liabilities
As of June 30, 2017, the Company’s total liabilities equaled 583.07 MB, decreasing by 26.88 MB or 4.41% from December 31, 2016. The decreased liabilities mainly due to moving the penalties arising from construction delay to cost of construction.
Shareholder’s equity
As of June 30, 2017, Total shareholders' equity of the Company was 256.04 MB, decrease due to the resulting from 96.61 MB of net loss for the period.
Cash Flows
Unit: Million Baht
| Cash Flows | June 30, 2017 | June 30, 2016 |
|---|---|---|
| Cashflow from (used in) operating activities | 50.28 | (156.92) |
| Cashflow from (used in) investing activities | (32.74) | (5.22) |
| Cashflow from (used in) financing activities | (18.49) | 138.90 |
| Net increase (decrease) in cash and cash equivalents | (0.95) | (23.23) |
| Cash and cash equivalents at the end of the period | 48.65 | 36.01 |
The Company’s net cash acquired from the operating activities was 50.28 MB, with operating profits prior to changes in the operating assets and liabilities of 13.15 MB. The major reason for the change, due to the trade and other receivables increased 58.89 MB, and unbilled receivables and prepaid expenses to the subcontractors for the construction decreased of 77.29 MB and trade and other payable were increased of 16.07 MB.
Cash flow utilized in investment activities amounts to 32.74 MB, mainly from 30 MB of restricted deposits with financial institution for short-term loan facility and 3.69 MB was used to purchase fix assets.
Cash flow utilized in financing activities amounts to 18.49 MB; mainly from repayment of loans from financial institutions of 8.82 MB and debt settlement according to financial lease of 3.8 MB was arranged, with an interest expense of 5.87 MB.
Management Discussion & Analysis (MD&A) Quarter 3/2017
Overview
In its consolidated financial statements as of September 30, 2017, Phol Dhanya Pubic Company Limited (The Company) recorded revenue from sales and services of 251.92 MB, decreasing 23.90 MB or 8.66% compared to the revenue from sales and services of 275.82 MB in the same quarter of previous year. Revenue from sales and services of Occupational Safety, Health and Environment Products (SAFETY) and Control Environment Products (CE) were increase, however, Water Solution Products (WATER) recorded revenue recognized from construction contracting service of the community water supply projects decreased compared with the same quarter of previous year. In addition, the reversal of penalties arising from delays of constructions of 16.64 MB was recorded as deduction of revenue from construction and service contracts. In Quarter 3/2017, the Company’s profit before income tax was 1.13 MB and income tax credit balance of 11.05 MB from deferred tax assets which’s calculated from allowance for doubtful debts. In Quarter 3/2017, the Company’s profit before income tax was 1.13 MB and had income tax credit of 11.05 MB from deferred tax assets, the results in net profit attributable to equity holders of 12.18 MB in Quarter 3/2017, increasing by 2.48 MB or 25.53% compared to net profit attributable to equity holders of 9.70 in Quarter 3/2016.
For the nine months period of 2017, The Company’s revenue from sales and services totals 752.29 MB, decreasing 95.87 MB or 11.30%, compared to the revenue from sales and services of 848.16 MB in the same period of previous year. The Company’s consolidate net loss attributable to equity holders of 84.44 MB.
Operating performance
Unit: Million baht
| Quarter | 9 Months | |||||
|---|---|---|---|---|---|---|
| 3Q2017 | 3Q2016 | % YoY | 9M2017 | 9M2016 | % YoY | |
| Revenue from sales | 213.56 | 207.86 | 2.74% | 649.12 | 605.58 | 7.19% |
| Revenue from rendering of services | 18.03 | 5.06 | 256.54% | 38.47 | 16.06 | 139.54% |
| Revenue from construction and service contracts | 20.33 | 62.90 | -67.67% | 64.70 | 226.52 | -71.44% |
| Other Revenue | 1.86 | 1.88 | -1.21% | 6.51 | 3.82 | 70.55% |
| Total Revenue | 253.78 | 277.70 | -8.61% | 758.80 | 851.98 | -10.94% |
| Cost of sales | 157.22 | 152.97 | 2.78% | 476.80 | 449.36 | 6.11% |
| Cost of rendering of services | 16.05 | 2.93 | 448.12% | 36.68 | 11.92 | 207.82% |
| Cost of construction and service contracts | 44.67 | 56.03 | -20.28% | 114.10 | 198.55 | -42.53% |
| Total Costs | 217.94 | 211.92 | 2.84% | 627.58 | 659.83 | -4.89% |
| Gross Profit | 33.99 | 63.90 | -46.81% | 124.71 | 188.33 | -33.78% |
| Gross Profit (%) | 13.49% | 23.17% | -41.77% | 16.58% | 22.20% | -5.63% |
| Total Selling & Administrative Expenses | 31.70 | 50.30 | -36.97% | 222.02 | 142.47 | 55.84% |
| Profit (Loss) before Finance Costs and Income Taxes Expense | 4.14 | 15.48 | -73.26% | (90.80) | 49.68 | -282.77% |
| Profit (Loss) before Finance Costs and Income Taxes Expense (%) | 1.63% | 5.57% | -70.74% | -11.97% | 5.83% | -17.80% |
| Profit (Loss) attributable to equity holders | 12.18 | 9.70 | 25.53% | (84.44) | 33.25 | -353.97% |
| Net Profit (Loss) (%) | 4.80% | 3.49% | 37.36% | -11.13% | 3.90% | -15.03% |
| Basic earnings per share (Baht) | 0.06 | 0.06 | 0.42% | (0.42) | 0.21 | -303.18% |
| Weighted average number of ordinary shares (Million shares) | 202.50 | 162.00 | 202.50 | 162.00 | ||
Revenue
In Quarter 3/2017, the Company’s sales and services were 251.92 MB, comprise 213.56 MB of revenue from sales, 18.03 MB of revenue from services and 20.33MB of revenue from construction contracts. Total revenue decreased by 23.90 MB or 8.66%, compared with 275.82 MB in the same quarter of previous year. Revenue from Occupational Safety, Health and Environment Products or SAFETY was 174.99 MB, which similar to the same quarter of previous year. Revenue earned from Control Environment Products or CE was 43.74 MB, increasing by 12.31% compared with the same quarter of previous year. Major customers are in the electronics industry which has been growth according to market export growth.
Revenue from Water Solution Products or WATER equals 33.19 MB, decreasing by 34.21 MB or 50.76% compared with the same quarter of previous year, due to revenue recognized from construction contracting service of the community water supply project was decreased. However, Revenue from services of water treatment systems in industrial customers were increase compared with the same quarter of previous year
Cost of Sales and Services
The Company’s cost of sales and services in Quarter 3/2017 were 217.94 MB, comprising of 157.22 MB cost of sales and 16.05 MB cost of services and 44.67 MB cost of construction. Cost of sales increased proportionally with more revenue from sales. Cost of services increased proportionally with more revenue from services and depreciation cost for services. Cost of construction was high than revenue due to the extra cost to rush the project completion and records the penalties arising from construction delay in cost of construction. In quarter 3/2017, The Company’s gross profit of 13.49% which decrease, compare with 23.17% of the same quarter of previous year.
Selling and Administrative Expenses
In Quarter 3/2017, selling and administrative expenses amounted to 48.34 MB comprising of 20.33 MB selling expenses and 28.01 MB administrative expenses. Selling expenses were decrease; however, administrative expenses were increase due to the record of allowance for doubtful account-sub contractors increased.
Net profit
In Quarter 3/2017, The Company’s profit before income tax was 1.13 MB and income tax credit balance of 11.05 MB from deferred tax assets. The company’s consolidate net profit (attributable to equity holders of the Company) was 12.18 MB, accounted for net profit margin 4.80%
Financial Position
Unit: Million baht
| September 30, 2017 | December 31, 2016 | % Change | |||
|---|---|---|---|---|---|
| Amount | % | Amount | % | ||
| Current Assets | 563.37 | 49.67% | 770.07 | 80.14% | -26.84% |
| Non-Current Assets | 226.10 | 19.93% | 190.88 | 19.86% | 18.45% |
| Current Liabilities | 480.75 | 42.39% | 534.12 | 55.51% | -9.99% |
| Non-Current Liabilities | 41.69 | 3.68% | 75.82 | 7.88% | -45.01% |
| Shareholder's Equity of the Company | 268.33 | 23.66% | 352.31 | 36.61% | -23.84% |
Assets
As of September 30, 2017, the Company’s total assets equaled 789.47 MB, decreasing by 171.48 MB or 17.85% from December 31, 2016. The decreased assets were mainly from current assets decreasing from 131.78 MB of other receivables from allowance for doubtful debt for receivables for penalties arising from delays of construction. And unbilled receivables and prepaid expenses to the subcontractors for the construction decreased of 118.43 MB. Non-current assets amount to 226.10 MB, mainly increase from 30 MB of restricted deposits with financial institution for short-term loan facility and deferred tax assets increased of 17.89 MB.
Liabilities
As of September 30, 2017, the Company’s total liabilities equaled 522.44 MB, decreasing by 87.50 MB or 14.35% from December 31, 2016. The decreased liabilities mainly due to the decreased of 37.22 MB in short-term loans from financial institutions and moving the penalties arising from construction delay to cost of construction.
Shareholder’s equity
As of September 30, 2017, Total shareholders' equity of the Company was 268.33 MB, decrease due to the resulting from 86.48 MB of net loss for the period.
Cash Flows
Unit: Million Baht
| Cash Flows | September 30, 2017 | September 30, 2016 |
|---|---|---|
| Cashflow from (used in) operating activities | 87.56 | (111.09) |
| Cashflow from (used in) investing activities | (32.22) | (11.20) |
| Cashflow from (used in) financing activities | (62.35) | 302.81 |
| Net increase (decrease) in cash and cash equivalents | (7.01) | 180.52 |
| Cash and cash equivalents at the end of the period | 42.32 | 239.83 |
The Company’s net cash acquired from the operating activities was 87.56 MB, with operating profits prior to changes in the operating assets and liabilities of 15.86 MB. The major reason for the change, due to the trade and other receivables increased 76.02 MB, and unbilled receivables and prepaid expenses to the subcontractors for the construction decreased of 118.43 MB and trade and other payable were increased of 9.14 MB.
Cash flow utilized in investment activities amounts to 32.22 MB, mainly from 30 MB of restricted deposits with financial institution for short-term loan facility and 3.96 MB was used to purchase fix assets, but proceeds from sales of fixed assets of 1.19 MB.
Cash flow utilized in financing activities amounts to 62.35 MB; mainly from repayment of loans from financial institutions of 47.83 MB and debt settlement according to financial lease of 5.50 MB was arranged, with an interest expense of 9.02 MB.
Management Discussion & Analysis (MD&A) Yearly 2017
Overview
The consolidated financial statements as of December 31, 2017, Phol Dhanya Pubic Company Limited (The Company) recorded revenue from sales and services of 985.84 MB, decreasing 112.15 MB or 10.21% compared to the revenue from sales and services of 1,097.99 MB in the previous year. Revenue from sales and services of Occupational Safety, Health and Environment Products (SAFETY) and Control Environment Products (CE) were increase according to expansion of manufacturing industries. However, Water Solution Products (WATER) recorded revenue from construction contracting service of the community water supply projects decreased compared with the previous year. In addition, the reversal of penalties arising from delays of constructions was recorded as deduction of revenue from construction and service contracts. The result of delayed completion of the construction continuously, the Company had more penalties arising from the delay of projects and costs overrun. In 2017, the company estimated liabilities arising from the delay of this project for 156.18 MB, however the amount of 129.84 MB was reclaimable from the sub-contractors. The Company assessed its ability to reclaim the penalties from the sub-contractors and estimated that the Company cannot reclaim any penalties from the sub-contractors. The Company has during taking the legal action to the sub-contractor for the penalties, in accordance with the conservative principle, the Company records the penalties arising from construction delay incurred in 2017 as cost of construction and fully provision for doubtful of 59.65 MB. However, the Company will recognized penalties as revenue when reclaim penalties from the sub-contractors.
In addition, The Company used DCF for asset valuation, therefore, the impairment of assets for drilling machines are 10 MB in quarter 4/2017. In 2017, the Company’s loss before income tax was 134.98 MB and income tax credit balance of 17.50 MB from deferred tax assets which’s calculated from allowance for doubtful debts. The Company’s consolidate net loss attributable to equity holders of 117.48 MB in 2017.
Operating performance
Unit: Million baht
| 2017 | 2016 | % YoY | |
|---|---|---|---|
| Revenue from sales | 863.37 | 816.53 | 5.74% |
| Revenue from rendering of services | 44.70 | 21.11 | 111.73% |
| Revenue from construction and service contracts | 77.77 | 260.35 | -70.13% |
| Other Revenue | 8.83 | 4.87 | 81.35% |
| Total Revenue | 994.68 | 1,102.87 | -9.81% |
| Cost of sales | 631.44 | 606.72 | 4.07% |
| Cost of rendering of services | 43.16 | 21.88 | 97.29% |
| Cost of construction and service contracts | 171.96 | 232.74 | -26.12% |
| Total Costs | 846.56 | 861.34 | -1.72% |
| Gross Profit | 139.28 | 236.65 | -41.15% |
| Gross Profit (%) | 14.13% | 21.55% | |
| Total Selling & Administrative Expenses | 269.82 | 246.79 | 9.33% |
| Profit (Loss) before Finance Costs and Income Taxes Expense | (121.71) | (5.26) | 2,212.05% |
| Profit (Loss) before Finance Costs and Income Taxes Expense (%) | (12.24%) | (0.48%) | |
| Profit (Loss) attributable to equity holders | (117.48) | (15.25) | 670.53% |
| Net Profit (Loss) (%) | (11.81%) | (1.38%) | |
| Basic earnings per share (Baht) | (0.58) | (0.08) | 622.19% |
| Weighted average number of ordinary shares (Million shares) | 202.50 | 189.80 |
|
Revenue
Unit: Million baht
| 2017 | % | 2016 | % | % YoY | |
|---|---|---|---|---|---|
| Occupational Safety, Health and Environment Products (SAFETY) | 715.18 | 72.54% | 687.37 | 62.60% | 4.05% |
| Control Environment Products (CE) | 163.84 | 16.62% | 130.29 | 11.87% | 25.74% |
| Water Solution Products (WATER) | 106.83 | 10.84% | 280.34 | 25.53% | -61.89% |
| Total revenue from sales and services | 985.84 | 100% | 1,097.99 | 100% | -10.21% |
In 2017, the Company’s sales and services were 985.84 MB, comprise 863.37 MB of revenue from sales, 44.70 MB of revenue from services and 77.77 MB of revenue from construction contracts. Total revenue decreased by 112.15 MB or 10.21%, compared with 1.097.99 MB in the previous year.
The overall of industrial economics outlook for the year 2017 has continued growth. Total manufacturing sector expanded by almost all industries, supported from both the export sector and domestic consumption demand. In particular, export-oriented production which is recovering in line with global economic. The company's customers which mostly in the key industries such as automotive industry and electronic industry and petrochemical have increased their demand for products and services of the Company. Revenue from sales and services of Occupational Safety, Health and Environment Products (SAFETY) was 715.18 MB, increasing by 27.81 MB, or 4.05%, from the previous year, mainly due to the revenue from sales and services of technical products. In addition, revenue from sales in government sector and new customers were increased.
Revenue earned from Control Environment Products or CE was 163.84 MB, increasing by 33.54 MB or 25.74% compared with the previous year. Major customers are in the electronics industry which has been growth according to market export growth.
Revenue from Water Solution Products or WATER equals 106.83 MB, decreasing by 173.50 MB or 61.89% compared with the previous year, due to revenue recognized from construction contracting service of the community water supply project was decreased and the reversal of penalties arising from delays of constructions was recorded as deduction of revenue from construction and service contracts. However, Revenue from services of water treatment systems in industrial customers were increase compared with previous year.
Other revenues equals 8.83 MB comprise 5.06 MB of gain on exchange rate and 3.77 MB of income from properties rental and others.
Cost of Sales and Services
The Company’s cost of sales and services in 2017 were 846.56 MB, comprising of 631.44 MB cost of sales and 43.16 MB cost of services and 171.96 MB cost of construction. Cost of sales increased proportionally with more revenue from sales. Cost of services includes depreciation cost for services increased proportionally with more revenue from services. Cost of construction was high than revenue due to the extra cost to rush the project completion.
Total Cost was accounted for 85.87% of total sales and services revenue, in 2017 the Company’s gross profit margin of 14.13% % which decreased compare with 21.55% of the previous year. However, gross profit margin from sales and services of SAFETY and CE products were increase, due to the increase of sales of high margin products and cost of goods decreased from the appreciation of baht.
Selling and Administrative Expenses
In 2017, selling and administrative expenses were 269.82 MB comprising 91.62 MB of selling expenses and 178.20 MB of administrative expenses. The mostly of sales and administrative expenses were decrease due to the policy to reduce unnecessary expenses of the Company in the second half. However, some of expenses such as transportation expenses and sales commission were increase according to revenue from sales. Administrative expenses included 59.65 MB of provision for doubtful debt for receivables for penalties arising from delays of construction, 10 MB of allowance for impairment of assets for drilling machines and 4.67 MB of penalties arising from delays of constructions.
The company’s financial cost was 13.27 MB, increasing due to the increase in loan from financial institution for working capital.
Net profit
In 2017, The Company’s loss before income tax was 134.98 MB and income tax credit balance of 17.50 MB from deferred tax assets. The company’s consolidate loss profit (attributable to equity holders of the Company) was 117.48 MB, accounted for net loss margin 11.81%
Financial Position
Unit: Million baht
| December 31, 2017 | December 31, 2016 | % Change | |||
|---|---|---|---|---|---|
| Amount | % | Amount | % | ||
| Current Assets | 576.63 | 50.84% | 770.07 | 80.14% | -25.12% |
| Non-Current Assets | 210.85 | 18.59% | 190.88 | 19.86% | 10.46% |
| Current Liabilities | 484.34 | 42.70% | 534.12 | 55.51% | -9.32% |
| Non-Current Liabilities | 69.02 | 6.09% | 75.82 | 7.88% | -8.97% |
| Shareholder's Equity of the Company | 235.43 | 20.76% | 352.31 | 36.61% | -33.18% |
Assets
As of December 31, 2017, the Company’s total assets equaled 787.48 MB, decreasing by 173.47 MB or 18.05% from December 31, 2016. The decreased assets were mainly from current assets decreasing from 129.67 MB of other receivables from allowance for doubtful debt for receivables for penalties arising from delays of construction. And unbilled receivables and prepaid expenses to the subcontractors for the construction decreased of 160.69 MB. However, cash and cash equivalents were increase of 43.42 MB.
Non-current assets amount to 210.85 MB, mainly increase from 30 MB of restricted deposits with financial institution for short-term loan facility and deferred tax assets increased of 18.53 MB. However, property, plant and equipment – net decrease of 10 MB of allowance for impairment of assets for drilling machines and 6.96 MB of sales of vehicles.
Liabilities
As of December 31, 2017, the Company’s total liabilities equaled 553.36 MB, decreasing by 56.59 MB or 9.28% from December 31, 2016. The decreased liabilities mainly due to the decreased of 27.09 MB in short-term loans from financial institutions and 52.11 MB of moving the penalties arising from construction delay to cost of construction. However, trade and other payables were increase by 39.91 MB.
Non-current liabilities were increase mainly due to the increase of 5.75 MB from liabilities under finance lease MB and 7.14 MB of the long-term loans from financial institution. Employee benefit obligations were increase 2.46 MB.
Shareholder’s equity
As of December 31, 2017, Total shareholders' equity of the Company was 235.43 MB, decrease due to the resulting from 117.48 MB of net loss for the period.
Cash Flows
Unit: Million Baht
| Cash Flows | December 31, 2017 | December 31, 2016 |
|---|---|---|
| Cashflow from (used in) operating activities | 132.73 | (242.85) |
| Cashflow from (used in) investing activities | (31.23) | (14.54) |
| Cashflow from (used in) financing activities | (58.63) | 242.47 |
| Net increase (decrease) in cash and cash equivalents | 42.87 | (14.93) |
| Cash and cash equivalents at the end of the period | 92.23 | 44.13 |
The Company’s net cash acquired from the operating activities was 132.73 MB, with loss from operations before changes in operating assets and liabilities of 5.31 MB. The major reason for the change, due to the trade and other receivables increased 50.72 MB, and unbilled receivables and prepaid expenses to the subcontractors for the construction decreased of 160.69 MB and trade and other payable were increased of 39.16 MB.
Cash flow utilized in investment activities amounts to 31.23 MB, mainly from 30 MB of restricted deposits with financial institution for short-term loan facility and 4.84 MB was used to purchase fix assets and software, but proceeds from sales of fixed assets of 2.78 MB.
Cash flow utilized in financing activities amounts to 58.63 MB mainly from repayment of loans from financial institutions of 39.49 MB and debt settlement according to financial lease of 8.01 MB was arranged, with an interest expense of 11.12 MB.
Management Discussion & Analysis (MD&A) Yearly 2016
Overview
In its consolidated financial statements as of December 31, 2016, Phol Dhanya Pubic Company Limited (The company) recorded revenue from sales and services of 1,097.99 MB, increasing 183.09 MB or 20.01% compared to the revenue from sales and services of 914.90 MB in the previous year. The incremental revenue was mainly contributed by construction of community water system. However, due to the company’s insufficiency of construction foremen and lack of project management experience, the project faced inefficiency problem, especially in 4Q16, in which there were many ongoing projects with intense workloads and nearly the same project start and delivery dates. This led to inadequacy of labor and delayed completion of the construction of community water system. In 4Q16, the company estimated liabilities arising from the delay of this project for 97.11 MB, 80.39 MB of which was reclaimable from the contractors. Furthermore, some contractors left the site during the construction, resulting in non-reclaimable damage from delayed project completion and handover. The company, consequently, recorded liabilities from expected penalties of delayed project delivery of 56.51 MB. In response, the company promptly proceeded to replenish workers to accelerate the delayed construction, leading to additional expense and cost. These results in net loss attributable to equity holders of 15.25 MB in 2016, decreasing by 49.56 MB or 144.43% compared to net profit attributable to equity holders of 34.31 in 2015.
Operating performance
Unit : MB
| Y2016 | Y2015 | % YoY | |
|---|---|---|---|
| Revenue from sales | 816.53 | 847.39 | -3.64% |
| Revenue from rendering of services | 21.11 | 9.42 | 124.18% |
| Revenue from construction and service contracts | 260.35 | 58.09 | 348.16% |
| Other Revenue | 4.87 | 3.04 | 60.27% |
| Total Revenue | 1,102.87 | 917.94 | 20.15% |
| Cost of sales | 606.72 | 624.78 | -2.89% |
| Cost of rendering of services | 21.88 | 6.91 | 216.47% |
| Cost of construction and service contracts | 232.74 | 42.92 | 442.24% |
| Total Costs | 861.34 | 674.62 | 27.68% |
| Gross Profit | 236.65 | 240.29 | -1.51% |
| Gross Profit (%) | 21.55% | 26.26% | -4.71% |
| Total Selling & Administrative Expenses | 246.79 | 196.31 | 25.71% |
| Profit (Loss) before Finance Costs and Income Taxes Expense | (5.26) | 47.02 | -111.20% |
| Profit (Loss) before Finance Costs and Income Taxes Expense (%) | (0.48%) | 5.12% | -5.60% |
| Profit (Loss) attributable to equity holders | (15.25) | 34.31 | -144.43% |
| Net Profit (%) | (1.38%) | 3.74% | -5.12% |
| Basic earnings per share (Baht) | (0.08) | 0.21 | -137.93% |
| Weighted average number of ordinary shares (Million shares)* | 189.80 | 162.00 |
*In 2016, The Company has increases, Issuance of the Capital Increase Ordinary Shares offered for the existing shareholder of the Company proportionately to their shareholding (RO) of 40,499,996 Shares
Revenue
Unit : MB
| Revenue structure | 2016 | % | 2015 | % | %YoY |
|---|---|---|---|---|---|
| Occupational Safety, Health and Environment Products (SAFETY) | 687.37 | 62.60% | 715.45 | 78.20% | -3.92% |
| Control Environment Products (CE) | 130.29 | 11.87% | 104.82 | 11.46% | 24.30% |
| Water Solution Products (WATER) | 280.34 | 25.53% | 94.64 | 10.34% | 196.22% |
| Total revenue from sales and services | 1,097.99 | 100% | 914.90 | 100% | 20.01% |
In 2016, the company’s sales and services were 1,097.99 MB, increasing by 183.09 MB or 20.01%, compared with 914.90 MB of previous year.
Revenue from sales and services of Occupational Safety, Health and Environment Products (SAFETY) was 687.37 MB, dropping by 28.08 MB, or 3.92%, from the previous year. Overall, related industries expanded at a moderate pace, especially those of our core customers, including automobile manufacturing industry which slightly expanded on a y-o-y basis. Continuously affected by oil price instability, the customers in petrochemical industry cut their budgets and number of staff, leading to reduction in demand for SAFETY products. And revenue from government sector also declined as the company won fewer bids compared to 2015 owning to its policy not to focus on projects with excessively low gross margin. Nevertheless, the company adjusted its strategy by expanding sales area to obtain new customers. Collaboration with trade partners in market expansion and improvement of sales force’s product knowledge also brought in incremental SAFETY sales from new customers and new products. Financial, improvement in after-sales services for technical products led to increased revenue from service rendering.
Revenue from sales of Control Environment Products (CE) was 130.29 MB, increasing by 25.47 MB, or 24.30%, compared to the previous year. Core customers continued to be companies in electronic industry, although the industry was impacted by market slowdown and changes in technologies. Despite the fact that competition in CE products was naturally intense, CE customers do not frequently change the suppliers due to concerns over impact on their production process. With this in mind, the company aimed at optimizing cost, increasing the speed of service, and building brand loyalty to retain existing customer base in order to boost revenue from sales of CE products.
Revenue from Water Solution Products (WATER) amounts to 280.34 MB, increasing by 185.70 MB or 196.22% compared with the previous year, due to the revenue recognized from construction contracting service of the community water supply project of 252.01 million baht.
Cost of Sales and Services
In 2016, The company’s cost of sales and services was 861.34 MB, comprising of 606.72 MB cost of sales which decreased variable from lower revenue from sales. And 21.88 MB cost of services increased due to revenue from SAFETY services was increase compare with the previous year and 232.74 MB cost of construction and service contracts was increase variable from the proportion revenue from construction.
Cost of sales and services was accounted for 78.45% of total sales and services revenue, revenue since gross profit of the construction contracting service for the community water supply project is not very high, and had incremental cost from construction projects, and the reduced gross profits from sales due to the competition in the market. In addition, gross profit of service is not very high due to fix cost from depreciation but lower revenue from services, leading to a gross profit of 21.55% which decrease, compare with 26.26% of the previous year.
Selling and Administrative Expenses
In 2016, selling and administrative expenses amounted to 246.79 MB comprised of selling expenses amounted to 92.30 MB. Selling expenses was decrease due to employees’ compensation which variable from lower revenue from sales, including commission and incentives. And 97.98 MB of administrative expenses, increase due to the increase in number of personnel and recorded 56.51 MB of liabilities from expected penalties arissing from delays of constructions which cannot collect from sub-contractors.
In 2016, the company’s financial cost amounted to 11.01 MB, increasing due to the increase in loan from financial institution for working capital.
Net profit
The effects from estimated liabilities from expected penalties arissing from delays projects, the company’s consolidate net loss (attributable to equity holders of the Company) was 15.25 MB, accounted for net loss margin 1.38% which decrease compare with 32.31 MB, accounted for net profit margin 3.74% in the previous year.
Profitability Ratio
| Consolidated | 2016 | 2015 |
|---|---|---|
| Gross Profit Margin | 21.55% | 26.26% |
| Operating Profit Margin | 1.34% | 6.70% |
| Net Profit (Loss) Margin | (1.38%) | 3.74% |
| Return on Equity | (4.53%) | 10.61% |
Financial Position
Unit : MB
| December 31, 2016 | December 31, 2015 | % Change | |||
|---|---|---|---|---|---|
| Amount | % | Amount | % | ||
| Assets | 960.95 | 100.00% | 667.40 | 100.00% | 43.99% |
| Liabilities | 619.95 | 63.48% | 346.10 | 51.86% | 76.23% |
| Shareholders’ equity of the Company | 352.31 | 36.53% | 322.59 | 48.14% | 9.21% |
Assets
As of December 31, 2016, the company’s total assets equaled 960.95 MB, increasing by 293.56 MB or 43.99% from December 31, 2015. The increased assets were mainly from current assets acquired from advance payment for construction of the Community Water Supply Project increase 5.36 MB. Receivables for penalties arising from delays of constructions increase 11.24 MB, advance payments increase 13.82 MB and unbilled receivables was increase 127.74 MB. Inventories-net increase from finish goods 11.16 MB and construction contracts in progress increased 2.79 MB and allowance for diminution in value of inventories increased by 2.08 MB.
Non-current assets were increase, due to the increase from property, plant and equipment from purchased 21.87 MB of Water well drilling machines, 8.17 MB of furniture and equipment, 6.70 MB of construction in progress and 2.75 MB of other assets. Non-current assets were decrease from amortization amount to 7.79 MB and depreciation amount to 18.83 MB.
Liabilities
As of December 31, 2016, the company’s total liabilities equaled 619.95 MB, increasing by 263.85 MB or 76.23% from December 31, 2015 mainly due to the increased from short-term loans from financial institutions increased 174.45 MB. The Company issued and offered additional unsecured Bill of Exchange increase 100 million baht In addition, promissory notes were increase 35 MB and short-term loan - trust receipt was increase 39.84 MB for working capital. And recorded penalties arissing from delays of constructions amount to 56.51 MB. However, trade and other payables were decrease by 27.26 MB.
Non-current liabilities were increase mainly due to the increase from liabilities under finance lease amount to 15.13 MB and of 32.32 MB of the long-term loans from financial institution. Employee benefit obligations was increase 2.70 MB.
Shareholder’s equity
As of December 31, 2016, Shareholders’ equity of the Company was 352.31 MB. In quarter 3/2016, the company issue and allot 40,499,996 new ordinary shares (at the par value of Baht 1) to the existing shareholders (Rights Offer) at a ratio of 4 existing shares to 1 new ordinary share, at an offer price of Baht 2 per share. The company has received the whole amount of money (more detail : the note 22 to the financial statements for year 2016) As of December 31, 2016, the company issued and paid-up share capital amount to 202.50 MB and premium on share capital were increase 40.15 MB. Retained earnings was decrease due to the resulting from net loss was 15.25 MB and decreasing by 35.64 million baht from dividend payment.
In 2016, the Company had debt-to-equity ratio of 1.74 times, increased from 1.07 times in 2015, due to the increase in liabilities.
Emphasis of matter
Attention to the Note 31 to the financial statements for year 2016, during, the Company found the error due to un-recognition of change in the Company’s ownership interest in subsidiary company (PD Genesis Engineering Co., Ltd). Therefore the Company made an adjustment by increasing the deficit from the change in the ownership interests in the consolidated financial statements amount to 1.54 million baht. As such, the consolidated statements of financial position as at December 31, 2015 and January 1, 2015, of the company which have been presented herewith for comparative purposes, have been restated for the effect of such adjustment.
Cash Flows
Unit : MB
| Cash Flows | December 31, 2016 | December 31, 2015 |
|---|---|---|
| Cashflow from (used in) operating activities | (238.14) | (23.21) |
| Cashflow from (used in) investing activities | (14.54) | (4.29) |
| Cashflow from (used in) financing activities | 242.47 | 55.20 |
| Net increase (decrease) in cash and cash equivalents | (10.21) | 27.70 |
| Cash and cash equivalents at the end of the period | 48.85 | 59.14 |
The Company’s net cash utilized in the operating activities was 238.14 MB, with operating profits prior to changes in the operating assets and liabilities of 77.30 MB. The major reason for the change was due to the trade and other receivables were increase 23.87 MB and unbilled receivables and prepaid expenses for the construction of the community water supply projects of 238.08 MB. However, trade and other payables were decrease by 26.09 MB.
Cash flow used in investment activities amounts to 14.54 MB to purchase equipment and other assets amount to 10.92 MB and Assets under water sales agreement amount to 6.70 MB. Meanwhile, cash flow received from sales of fix assets totals 1.56 MB and interests received of 0.74 MB.
Cash flow acquired from financing activities amounts to 242.47 MB from short-term loans were increased by 169.10 MB and loans from financial institution were increased by 50 MB. And cash flow received from increase in share capital amount to 80.65 MB. At the same time, loan repayment to financial institutions amounts to 12.55 MB and debt settlement according to financial lease of 3.93 MB, with an interest expense of 5.16 MB and dividend payment of 35.64 MB.
Expected performance in 2017
Thai economy is expected to gradually expand, supported by economy-boosting government policies and government investment which has continued from the previous year. Production in various industries is seen to be spurred by domestic consumption. Export, which depends on global economy and global trade and, therefore, is impacted by multiple risk factors and instabilities, is also expected to increase. These are supporting factors for industry sector’s product demand. Corporate sector’s demand for SAFETY and CE products is expected to rise accordingly. With this prospect, the company aims at offering comprehensive services, developing expertise for its personnel, developing new products to seize market share, better serve existing customers, and expand into the customer base in which the company’s market share is small, and increasing market share for the company’s house brands.
The company still sees possibility for growth in its water solution business as it will be bolstered by continuing government policy on water management and the constant need for water treatment systems in industry sector. The company believes that, by virtue of its potential and determination, it will be able to develop personnel and working team to be experts in the business. Improvement in efficient project management and adjustment of internal processes will drive the company’s water solution business to grow and create sustainable profits for the company in the future.
Management Discussion & Analysis (MD&A) Quarter 3/2016
Overview
In Quarter 3/2016, Phol Dhanya Public Company Limited (the Company)’s revenue from sales and services totals 275.82 million baht, increasing by 48.71 million baht or 21.45% YoY, compare with 227.11 million baht in the same quarter of the previous year, due to the increase of revenue from rendering of services from the community water supply projects. In Quarter 3/2016, the Company’s net profit (attributable to owners of the parent) was 9.75 million baht, increasing by 7.09 million baht or 271.85% YoY compare with 2.61 million baht in the same quarter of the previous year. However, revenue from community water supply projects have lower margin, causing the average gross profit margin in Quarter 3/2016 was account for 23.17%, decrease from 24.97% in the same quarter of the previous year.
For the year, ended September 30, 2016, The company’s revenue from sales and services totals 848.16 million baht, increasing by 203.96 million baht or 31.66%, compared with 644.20 million baht in the same period of previous year. The Company’s consolidate net profit (attributable to owners of the parent) was 33.25 million baht, increasing by 15.15 million baht or 83.72%, compared with 18.10 million baht in the same period of previous year.
Operating performance
Unit : Million baht
| Quarter | 9 Month | |||||||
|---|---|---|---|---|---|---|---|---|
| 3Q2016 | 3Q2015 | % YoY | 2Q2016 | % QoQ | Y2016 | Y2015 | % YoY | |
| Revenue from sales | 207.86 | 222.99 | -6.78% | 194.25 | 7.01% | 605.58 | 637.13 | -4.95% |
| Revenue from rendering of services | 67.96 | 4.12 | 1551.03% | 109.37 | -37.86% | 242.58 | 7.07 | 3331.21% |
| Other Revenue | 1.88 | 0.48 | 292.89% | 1.47 | 27.55% | 3.82 | 2.37 | 61.09% |
| Total Revenue | 277.70 | 227.59 | 22.02% | 305.09 | -8.98% | 851.98 | 646.57 | 31.77% |
| Cost of sales | 152.97 | 166.74 | -8.26% | 144.63 | 5.76% | 449.36 | 467.41 | -3.86% |
| Cost of rendering of services | 58.96 | 3.66 | 11.71% | 94.94 | -37.90% | 210.46 | 5.88 | 3477.21% |
| Total Costs | 211.92 | 170.39 | 24.37% | 239.58 | -11.54% | 659.83 | 473.29 | 39.41% |
| Gross Profit | 63.90 | 56.71 | 12.67% | 64.04 | -.022% | 188.33 | 170.91 | 10.19% |
| Gross Profit (%) | 23.17% | 24.97% | -1.81% | 21.09% | 2.07% | 22.20% | 26.53% | -4.33% |
| Total Selling & Administrative Expenses | 50.30 | 52.19 | -3.62% | 45.95 | 9.45% | 142.47 | 145.52 | -2.10% |
| EBIT | 15.48 | 5.01 | 209.21% | 19.56 | -20.85% | 49.68 | 27.76 | 78.96% |
| EBIT (%) | 5.57% | 2.20% | 3.37% | 6.41% | -0.84% | 5.83% | 4.29% | 1.54% |
| Net Profit (Equity holders of the Company) | 9.70 | 2.61 | 271.85% | 13.59 | -28.62% | 33.25 | 18.10 | 83.72% |
| Net Profit (%) | 3.49% | 1.15% | 2.35% | 4.45% | -21.58% | 3.90% | 2.80% | 1.10% |
| Basic earnings per share (Baht) | 0.06 | 0.02 | 271.85% | 0.08 | -28.62% | 0.11 | 0.11 | 83.72% |
| Weighted average number of ordinary shares (Million shares) | 162.00 | 162.00 | 0.00% | 162.00 | 0.00% | 162.00 | 162.00 | 0.00% |
Revenue
Unit : Million Baht
| Revenue structure | Quarter | 9 Month | |||||||||||
|---|---|---|---|---|---|---|---|---|---|---|---|---|---|
| 3Q2016 | % | 3Q2015 | % | % YoY | 2Q2016 | % | %QoQ | Y 2016 | % | Y 2015 | % | %YoY | |
| Occupational Safety, Health and Environment Products (SAFETY) | 174.48 | 63% | 184.79 | 81% | -5.58% | 165.88 | 55% | 5.18% | 512.33 | 60% | 527.77 | 82% | -293% |
| Control Environment Products (CE) | 33.94 | 12% | 30.18 | 13% | 12.45% | 29.51 | 10% | 15.02% | 93.52 | 11% | 83.11 | 13% | 12.52% |
| Water Solution Products (WATER) | 67.40 | 24% | 12.14 | 5% | 455.19% | 108.22 | 36% | -37.72% | 242.31 | 29% | 33.32 | 5% | 627.19% |
| Total revenue from sales and services | 275.82 | 100% | 227.11 | 100% | 21.45% | 303.61 | 100% | -9.15% | 848.16 | 100% | 644.20 | 100% | 31.66% |
In Quarter 3/2016, the Company’s revenue from sales and services were 275.82 million baht, increasing by 48.71 million baht or 21.45%, compared with 227.11 million baht in the same quarter of previous year.
Revenue from Occupational Safety, Health and Environment Products or SAFETY amounts to 174.48 million baht, decreasing by 10.31 million baht or 5.58% YoY, compared with the same quarter of previous year. In general, production sector has not expanded much. For example, automotive industry expanded a little compare with the last year, and petrochemical industry had been affected from the oil price volatility, budget and worker reduction, This cause the reduction in the demand of Safety products. However, the company has adjusted the strategy by expanding sales coverage area, revenue from new customers were increase.
Revenue from Control Environment Products or CE amounts to 33.94 million baht, increasing by 3.76 million baht or 12.45% compared with the same quarter of previous year. Major customers are in the electronics industry. The Company emphasizes on retaining existing customers with high potential and identifying competitive products to increase revenue from the CE Products.
Revenue from Water Solution Products or WATER amounts to 67.40 million baht, increasing by 55.26 million baht or 455.19% YoY, compared with the same quarter of previous year, due to the revenue recognized from construction contracting service of the community water supply project of 62.11 million baht.
Cost of Sales and Services
The Company’s cost of sales and services in Quarter 3/2016 was 211.92 million baht, comprising of 152.97 million baht cost of sales and 58.96 million baht cost of services. The latter has increased proportionally with more services rendered. Costs of sales and services account for 76.83% of sales and service revenue since gross profit of the construction contracting service for the community water supply project is not very high, coupled with the reduced gross profits from sales due to the competition in the market, leading to a gross profit of 23.17%.
Selling and Administrative Expenses
In Quarter 3/2016, selling and administrative expenses amounted to 50.30 million baht comprised of selling expenses amounted to 24.75 million baht and administrative expenses amounted to 25.54 million baht. The increase in selling and administrative expenses increase due to the increase in number of personnel. However, Selling and Administrative expenses were decrease due to the same period of previous year; the Company was recorded loss on impairment on assets 2.58 million baht and loss on exchange rate 1.03 million baht.
In Quarter 3/2016, the Company’s financial cost amounted to 3.46 million baht, increasing by 2.38 million baht or 220.43%, due to the increase in loan from financial institution to support the water treatment business.
Net profit
In Quarter 3/2016, the Company’s consolidate net profit (attributable to equity holders of the Company) was 9.70 million baht, accounted for net profit margin 3.49%. The Company’s net profit was increase by 7.09 million baht or 271.85% YoY compare with 2.62 million baht, accounted for net profit margin 2.35% in the same quarter of the previous year.
Financial Position
Unit : Million baht
| September 30, 2016 | December 31, 2015 (Restated) |
% Change | |||
|---|---|---|---|---|---|
| Amount | % | Amount | % | ||
| Assets | 1,107.56 | 100.00% | 667.40 | 100.00% | 65.95% |
| Liabilities | 707.82 | 63.91% | 346.10 | 51.86% | 104.51% |
| Shareholders’ equity of the Company | 400.97 | 36.20% | 322.59 | 48.34% | 24.30% |
Assets
As of September 30, 2016, the Company’s total assets equaled 1,107.56 million baht, increasing by 440.16 million baht or 65.95% from December 31, 2015. The increased assets were mainly from current assets acquired from unbilled receivables amount to 142.67 million baht and advance payment for construction of the Community Water Supply Project amount to 69.47 million baht. Current deposits was increase from excess of share subscription.
Liabilities
As of September 30, 2016, the Company’s total liabilities equaled 707.82 million baht, increasing by 361.72 million baht or 104.51% from December 31, 2015 mainly due to the increased from short-term loans from financial institutions amount to 226.68 million baht. The Company issued and offered additional unsecured Bill of Exchange increase 100 million baht In addition, the short-term loan, promissory notes and bank overdraft were increase 127.12 million baht and other payables were increase by 110.18 million baht from excess of share subscription. Non-current liabilities were increase mainly due to the long-term loans from financial institution of 50 million baht and Employee benefit obligations was increase 2 million baht.
Shareholder’s equity
As of September 30, 2016, Shareholders’ equity of the Company was 400.97 million baht. In quarter 3/2016, the company issue and allot 40,499,996 new ordinary shares (at the par value of Baht 1) to the existing shareholders (Rights Offer) at a ratio of 4 existing shares to 1 new ordinary share, at an offer price of Baht 2 per share. The company has received the whole amount of money (more detail : the note 22 to the financial statements for quarter 3/2016) In quarter 3/2016, the company issued and paid-up share capital amount to 202.50 million baht and premium on share capital were increase 40.15 million baht. The resulting from net profit was amount to 33.25 million baht and decreasing by 35.64 million baht from dividend payment.
Emphasis of matter
Attention to the Note 28 to the financial statements for quarter 3/2016, during, the Company found the error due to un-recognition of change in the Company’s ownership interest in subsidiary company (PD Genesis Engineering Co., Ltd). Therefore the Company made an adjustment by increasing the deficit from the change in the ownership interests in the consolidated financial statements amount to 1.54 million baht. As such, the consolidated statements of financial position as at December 31, 2015 and January 1, 2015, of the company which have been presented herewith for comparative purposes, have been restated for the effect of such adjustment.
Cash Flows
Unit : Million Baht
| Cash Flows | September 30, 2016 | September 30, 2015 |
|---|---|---|
| Cashflow from (used in) operating activities | (111.09) | (4.38) |
| Cashflow from (used in) investing activities | (11.20) | (20.79) |
| Cashflow from (used in) financing activities | 302.81 | 27.66 |
| Net increase (decrease) in cash and cash equivalents | 180.52 | 2.50 |
| Cash and cash equivalents at the end of the period | 239.83 | 33.97 |
The Company’s net cash utilized in the operating activities was 111.09 million baht, with operating profits prior to changes in the operating assets and liabilities of 66.33 million Baht. The major reason for the change was due to the trade and other receivables were increase 29.93 million baht and unbilled receivables and prepaid expenses for the construction of the community water supply projects of 212.15 million baht. In addition, other payables were increase by 110.18 million baht from excess of share subscription.
Cash flow used in investment activities amounts to 11.20 million baht to purchase machinery and equipment for water treatment service amount to 6.76 million baht and 1.5 million baht was disposed of to purchase assets for service provision of the SAFETY Products, and 4.73 million Baht was used to purchase equipment and other assets. Meanwhile, cash flow received from sales of fix assets totals 1.11 million baht and interests received of 0.61 million baht.
Cash flow acquired from financing activities amounts to 302.81 million baht; bank overdraft and short-term loans were increased by 223.08 million baht and loans from financial institution were increased by 50 million baht. And cash flow received from increase in share capital amount to 80.65 million baht. At the same time, loan repayment to financial institutions amounts to 9.26 million baht and debt settlement according to financial lease of 2.36 million baht was arranged, with an interest expense of 3.66 million baht and dividend payment of 35.64 million baht.
Management Discussion & Analysis (MD&A) Quarter 2/2016
Overview
In Quarter 2/2016, Phol Dhanya Public Company Limited (the Company)’s revenue from sales and services totals 303.61 million baht, increasing by 90.59 million baht or 42.53% YoY, compare with 213.02 million baht in the same quarter of the previous year, due to the increase of revenue from rendering of services from the community water supply projects. In Quarter 2/2016, the Company’s net profit was 13.59 million baht, increasing by 9.06 million baht or 200.14% YoY compare with 4.53 million baht in the same quarter of the previous year. However, revenue from community water supply projects have lower margin, causing the average gross profit margin in Quarter 2/2016 was account for 21.09%, decrease from 27.80% in the same quarter of the previous year.
For the six months period of 2016, The company’s revenue from sales and services totals 572.34 million baht, increasing by 155.24 million baht or 37.22%, compared with 417.09 million baht in the same period of previous year. The Company’s consolidate net profit (attributable to owners of the parent) was 23.55 million baht, increasing by 8.06 million baht or 52.04%, compared with 15.49 million baht in the same period of previous year.
Operating performance
Unit : Million baht
| Quarter | 6 Month | |||||||
|---|---|---|---|---|---|---|---|---|
| 2Q2016 | 2Q2015 | % YoY | 1Q2016 | % QoQ | Y2016 | Y2015 | % YoY | |
| Revenue from sales | 194.25 | 211.39 | -8.11% | 203.47 | -4.53% | 397.71 | 414.14 | -3.97% |
| Revenue from rendering of services | 109.37 | 1.63 | 6602.37% | 65.26 | 67.60% | 174.63 | 2.95 | 5811.85% |
| Other Revenue | 1.47 | 1.06 | 39.38% | 0.47 | 216.79% | 1.94 | 1.91 | 1.42% |
| Total Revenue | 305.09 | 214.08 | 42.51% | 269.19 | 13.34% | 574.28 | 419.01 | 37.06% |
| Cost of sales | 144.63 | 152.65 | -5.25% | 151.77 | -4.70% | 296.40 | 300.67 | -1.42% |
| Cost of rendering of services | 94.94 | 1.15 | 8191.17% | 56.56 | 67.87% | 151.50 | 2.23 | 6708.45% |
| Total Costs | 239.58 | 153.80 | 55.77% | 208.33 | 15.00% | 447.90 | 302.90 | 47.87% |
| Gross Profit | 64.04 | 59.23 | 8.13% | 60.40 | 6.03% | 124.44 | 114.20 | 8.96% |
| Gross Profit (%) | 21.09% | 27.80% | -6.71% | 22.48% | -1.38% | 21.74% | 27.38% | -5.64% |
| Total Selling & Administrative Expenses | 45.95 | 52.20 | -11.97% | 46.22 | -0.58% | 92.18 | 93.36 | -1.27% |
| EBIT | 19.56 | 8.08 | 141.98% | 14.64 | 33.58% | 34.20 | 22.75 | 50.30% |
| EBIT (%) | 6.41% | 3.78% | 2.64% | 5.44% | 0.97% | 5.96% | 5.43% | 0.52% |
| Net Profit (Equity holders of the Company) | 13.59 | 4.53 | 200.14% | 9.96 | 36.42% | 23.55 | 15.49 | 52.04% |
| Net Profit (%) | 4.45% | 2.11% | 2.34% | 3.70% | 20.37% | 4.10% | 3.70% | 0.40% |
| Basic earnings per share (Baht) | 0.08 | 0.03 | 200.14% | 0.06 | 36.42% | 0.15 | 0.10 | 52.04% |
| Weighted average number of ordinary shares (Million shares) | 162.00 | 162.00 | 0.00% | 162.00 | 0.00% | 162.00 | 162.00 | 0.00% |
Revenue
Unit : Million Baht
| Revenue structure | Quarter | 6 Month | |||||||||||
|---|---|---|---|---|---|---|---|---|---|---|---|---|---|
| 2Q2016 | % | 2Q2015 | % | % YoY | 1Q2016 | % | %QoQ | Y 2016 | % | Y 2015 | % | %YoY | |
| Occupational Safety, Health and Environment Products (SAFETY) | 165.88 | 55% | 172.74 | 81% | -3.97% | 171.96 | 64% | -3.53% | 337.84 | 59% | 342.98 | 82% | -1.50% |
| Control Environment Products (CE) | 29.51 | 10% | 25.63 | 12% | 15.13% | 30.07 | 11% | -1.87% | 59.58 | 10% | 52.93 | 13% | 12.56% |
| Water Solution Products (WATER) | 108.22 | 36% | 14.65 | 7% | 638.55% | 66.69 | 25% | 62.27% | 174.91 | 31% | 21.19 | 5% | 725.51% |
| Total revenue from sales and services | 303.61 | 100% | 213.02 | 100% | 42.53% | 268.72 | 100% | 12.98% | 572.33 | 100% | 417.10 | 100% | 37.22% |
In Quarter 2/2016, the Company’s revenue from sales and services were 303.61 million baht, increasing by 90.59 million baht or 42.53%, compared with 213.02 million baht in the same quarter of previous year.
Revenue from Occupational Safety, Health and Environment Products or SAFETY amounts to 165.88 million baht, decreasing by 6.86 million baht or 3.97% YoY, compared with the same quarter of previous year. However, Industrial market overview in Quarter 2/2016 was slowdown, the customer’s purchasing power were lower than expectancy due to the limited budget and pending projects of the customers.
Revenue from Control Environment Products or CE amounts to 29.51 million baht, increasing by 3.88 million baht or 15.13% compared with the same quarter of previous year. Major customers are in the electronics industry. The Company emphasizes on retaining existing customers with high potential and identifying competitive products to increase revenue from the CE Products.
Revenue from Water Solution Products or WATER amounts to 108.22 million baht, increasing by 93.57 million baht or 638.55% YoY, compared with the same quarter of previous year, due to the revenue recognized from construction contracting service of the community water supply project of 103.94 million baht. As of June 30, 2016, the project value that has not been delivered is approximately 260 million baht.
Cost of Sales and Services
The Company’s cost of sales and services in Quarter 2/2016 was 239.58 million baht, comprising of 144.63 million baht cost of sales and 94.94 million baht cost of services. The latter has increased proportionally with more services rendered. Costs of sales and services account for 78.91% of sales and service revenue since gross profit of the construction contracting service for the community water supply project is not very high, coupled with the reduced gross profits from sales due to the competition in the market, leading to a gross profit of 21.09%.
Selling and Administrative Expenses
In Quarter 2/2016, selling and administrative expenses amounted to 45.95 million baht comprised of selling expenses amounted to 22.24 million baht and administrative expenses amounted to 23.72 million baht. Selling and Administrative expenses were decrease due to the same period of previous year; the Company was recorded loss on impairment on assets 2.58 million baht and loss on exchange rate 2.38 million baht.
In Quarter 2/2016, the Company’s cost of financial amounted to 2.35 million baht, increasing by 1.38 million baht or 142.19%, due to the increase in loan from financial institution to support the water treatment business.
Net profit
In Quarter 2/2016, the Company’s consolidate net profit (attributable to equity holders of the Company) was 13.59 million baht, accounted for net profit margin 4.45%. The Company’s net profit was increase by 9.06 million baht or 200.14% YoY compare with 4.53 million baht, accounted for net profit margin 2.11%. in the same quarter of the previous year.
Financial Position
Unit : Million baht
| June 30, 2016 | December 31, 2015 (Restated) |
% Change | |||
|---|---|---|---|---|---|
| Amount | % | Amount | % | ||
| Assets | 832.99 | 100.00% | 667.40 | 100.00% | 24.81% |
| Liabilities | 507.46 | 60.92% | 346.10 | 51.86% | 46.62% |
| Shareholders’ equity of the Company | 326.76 | 39.23% | 322.59 | 48.34% | 1.29% |
Assets
As of June 30, 2016, the Company’s total assets equaled 832.99 million baht, increasing by 165.59 million baht or 24.81% from December 31, 2015. The increased assets were mainly from current assets acquired from unbilled receivables and from prepaid expenses to the subcontractors for the construction of the water purification system of 139.66 million baht. The net remaining inventory has increased by 53 million baht due to the increase of raw materials for construction of the community water supply projects.
Liabilities
As of June 30, 2016, the Company’s total liabilities equaled 507.46 million baht, increasing by 161.36 million baht or 46.62% from December 31, 2015 mainly due to the increased from short-term loans from financial institutions amount to 113.40 million baht. In Quarter 2/2016, the Company issued and offered additional unsecured Bill of Exchange amount to 50 million baht and the Company issued and offered unsecured Bill of Exchange amount to 100 million baht for roll-over the matured original Bill of Exchange. In addition, the short-term loan, promissory notes and bank overdraft were increase 69.76 million baht. Non-current liabilities were increase mainly due to the long-term loans from financial institution of 50 million baht in preparation for business expansion.
Shareholder’s equity
As of June 30, 2016, Shareholders’ equity of the Company was 326.76 million baht, increase by 23.55 million baht from the resulting from net profit and decreasing by 19.44 million baht from dividend payment.
Emphasis of matter
Attention to the Note 27 to the financial statements for quarter 2/2016, during, the Company found the error due to un-recognition of change in the Company’s ownership interest in subsidiary company (PD Genesis Engineering Co., Ltd). Therefore the Company made an adjustment by increasing the deficit from the change in the ownership interests in the consolidated financial statements amount to 1.54 million baht. As such, the consolidated statements of financial position as at December 31, 2015 and January 1, 2015, of the company which have been presented herewith for comparative purposes, have been restated for the effect of such adjustment.
Cash Flows
Unit : Million Baht
| Cash Flows | June 30, 2016 | June 30, 2015 |
|---|---|---|
| Cashflow from (used in) operating activities | (156.92) | (17.85) |
| Cashflow from (used in) investing activities | (5.22) | (5.01) |
| Cashflow from (used in) financing activities | 138.90 | 26.26 |
| Net increase (decrease) in cash and cash equivalents | (23.23) | 3.36 |
| Cash and cash equivalents at the end of the period | 36.01 | 34.95 |
The Company’s net cash utilized in the operating activities is 156.92 million baht, with operating profits prior to changes in the operating assets and liabilities of 48.24 million Baht. The major reason for the change was due to the unbilled receivables and prepaid expenses to the subcontractors for the construction of the community water supply projects of 142.33 million baht. Net inventory was increased by 53.94 million baht due to the increase of raw materials for construction of the community water supply projects. However, trade and other payables were decrease by 12.06 million baht.
Cash flow used in investment activities amounts to 5.22 million baht. 1.5 million baht was disposed of to purchase assets for service provision of the SAFETY Products, and 3.33 million Baht was used to purchase equipment and other assets. Loans to employees was increased by 0.88 million baht. Meanwhile, cash flow received from sales of fix assets totals 0.93 million baht and interests received of 0.25 million baht.
Cash flow acquired from financing activities amounts to 138.90 million baht; loans from financial institution were increased by 50 million baht, and bank overdraft and short-term loans were increased by 119.76 million baht. At the same time, loan repayment to financial institutions amounts to 5.98 million baht and debt settlement according to financial lease of 1.79 million baht was arranged, with an interest expense of 3.65 million baht and dividend payment of 19.44 million baht.
Management Discussion & Analysis (MD&A) Quarter 1/2016
Overview
In Quarter 1/2016, Phol Dhanya Public Company Limited (the Company)’s revenue from sales and services totals 268.72 million baht, increasing by 64.65 million baht or 31.68% YoY, compare with 204.07 million baht in the same quarter of the previous year, due to the increase services revenue of the community water supply projects.
However, the Company’s gross profit margin was decrease, due to revenue from community water supply projects which have lower margin, In addition, gross profit margin from sales was decrease also due to the higher competition, causing the average gross profit margin in Quarter 1/2016 to drop. In addition, the Company’s selling and administrative expenses and financial cost were increase, so the net profit (attributable to equity holders of the Company) was 9.96 million baht, decreasing by 1 million baht or 9.13% compared with 10.96 million baht in the same quarter of previous year.
Operating performance
Unit: Million baht
| 1Q2016 | 1Q2015 | % YoY | 4Q2015 | % QoQ | |
|---|---|---|---|---|---|
| Revenue from sales | 203.47 | 202.75 | 0.35% | 210.26 | -3.23% |
| Revenue from rendering of services | 65.26 | 1.32 | 4836.11% | 60.44 | 7.97% |
| Other Revenue | 0.47 | 3.23 | -85.60% | -1.73 | -126.94% |
| Total Revenue | 269.19 | 207.30 | 29.85% | 268.97 | 0.08% |
| Cost of sales | 151.77 | 148.02 | 2.53% | 157.37 | -3.56% |
| Cost of redering of services | 56.56 | 1.08 | 5136.46% | 43.95 | 28.68% |
| Total Costs | 208.33 | 149.10 | 39.72% | 201.33 | 3.48% |
| Gross Profit | 60.40 | 54.98 | 9.86% | 69.37 | -12.94% |
| Gross Profit (%) | 22.48% | 26.94% | -4.46% | 25.63 | -3.15% |
| Total Selling & Administrative Expenses | 46.22 | 43.53 | 6.17% | 48.39 | -4.48% |
| EBIT | 14.64 | 14.67 | -0.20% | 19.26 | -23.96% |
| EBIT (%) | 5.44% | 7.08% | -1.64% | 7.16 | -1.72% |
| Net Profit (Equity holders of the Company) | 9.96 | 10.96 | -9.13% | 16.22 | -38.58% |
| Net Profit (%) | 3.70% | 5.29% | -1.59% | 6.03 | -38.63% |
| Basic ernings per share (Baht) | 0.06 | 0.07 | -9.13% | 0.10 | -38.58% |
| Weighted average number of ordinary shares (Million shares) | 162.00 | 162.00 | 162.00 |
Revenue
Unit: Million Baht
| Revenue structure | 1Q2016 | % | 1Q20415* | % | %YoY | 4Q2015 | % | % QoQ |
|---|---|---|---|---|---|---|---|---|
| Ocupational Safety, Health and Environment Products (SAFETY) | 171.96 | 64% | 170.24 | 83% | 1.01% | 181.11 | 67% | -5.05% |
| Control Environment Products (CE) | 30.07 | 11% | 27.30 | 13% | 10.15% | 28.01% | 10% | 7.34% |
| Water Treatment Products (WATER) | 66.69 | 25% | 6.53 | 3% | 921.29% | 61.58 | 23% | 8.30% |
| Total revenue from sales and services | 268.72 | 100% | 204.07 | 100% | 31.68% | 270.70 | 100% | -0.73% |
Note:* The Company reclassified the type of revenue between SAFETY and CE Products, so the revenue structure had changed.
In Quarter 1/2016, the Company’s sales and services were 268.72 million baht, increasing by 64.65 million baht or 31.68%, compared with 204.07 million baht in the same quarter of previous year.
Revenue from Occupational Safety, Health and Environment Products or SAFETY was 171.96 million baht, which has increased slightly by 1.72 million baht or 1.01% YoY. The overall market for Safety products does not expand much in Quarter 1/2016, especially major industries e.g. automotive, with domestic purchasing power still not fully recovered, in spite of increasing manufacturing for export. Meanwhile, customers in the petrochemical industry got affected from the drop in oil price, leading to a budget cut and labor force reduction, subsequently lowering purchasing power in Safety products. However, the Company’s customers are dispersed in almost every industry, with the focus of sustaining growth in the existing customer base by increasing a more comprehensive product portfolio and finding new customers by expanding sales territory so that the Company can maintain growth in safety products.
The revenue earned from Control Environment Products or CE amounts to 30.07 million baht, increasing by 2.77 million baht or 10.15% compared with the same quarter of previous year. Major customers are in the electronics industry. The Company emphasizes on retaining existing customers with high potential and identifying competitive products to increase revenue from the CE Products.
Revenue from Water Treatment Products or WATER equals 66.69 million baht, increasing by 60.16 million baht or 921.29% YoY, comprising of revenue from system and water purification equipment sales of 4.88 million baht, sales of recycling waste water system of 5.52 million baht and revenue recognized from construction contracting service of the community water supply project of 56.29 million baht. As of March 31, 2016, the project value that has not been delivered is 365 million baht.
Cost of Sales and Services
The Company’s cost of sales and services in Quarter 1/2016 is 208.33 million baht, comprising of 151.77 million baht cost of sales and 56.56 million baht cost of services. The latter has increased proportionally with more services rendered. Costs of sales and services account for 77.52% of sales and service revenue since gross profit of the construction contracting service for the community water supply project is not very high, coupled with the reduced gross profits from sales due to the competition in the market, leading to a gross profit of 22.48%.
Selling and Administrative Expenses
In Quarter 1/2016, selling and administrative expenses amounted to 46.22 million baht comprised of selling expenses amounted to 23.08 million baht and administrative expenses amounted to 23.14 million baht. Selling expenses was increase due to the increase from revenue from sales and services.
In Quarter 1/2016, the Company’s cost of financial amounted to 1.76 million baht, increasing by 0.96 million baht or 121.28%, due to the increase in short-term loan from financial institution by issuing Bill of Exchange amounted to 100 million baht and promissory note amounted to 20 million baht to support the water treatment business.
Net profit
In Quarter 1/2016, the Company’s consolidate net profit (attributable to equity holders of the Company) was 9.96 million baht, accounted for net profit margin 3.70%
Financial Position
Unit: Million baht
| March 31, 2016 | December 31, 2015 | % Change | |||
|---|---|---|---|---|---|
| Amount | % | Amount | % | ||
| Assets | 702.81 | 100.00% | 667.40 | 100.00% | 5.31% |
| Liabilites | 371.46 | 52.85% | 346.10 | 51.86% | 7.33% |
| Shareholders' equity | 331.35 | 47.15% | 322.59* | 48.34% | 2.72% |
Note:* adjustment by increasing the deficit from the change in the ownership interests in subsidiary company.
Assets
As of March 31, 2016, the Company’s total assets equaled 702.81 million baht, increasing by 35.41 million baht or 5.31% from December 31, 2015. The increased assets were mainly from current assets acquired from unbilled receivables and from prepaid expenses to the subcontractors for the construction of the water purification system of 40.70 million baht. The net remaining inventory has increased by 16.43 million baht due to more projects acquired during the construction of the community water supply project. Non-current assets amount to 158.07 million baht, which is about the same as that of 2015.
Liabilities
As of March 31, 2016, the Company’s total liabilities equaled 371.46 million baht, increasing by 25.36 million baht or 7.33% from December 31, 2015. The major source of liabilities is long-term loans from financial institution of 50 million baht in preparation for business expansion. The loan agreement is detailed in the financial statement of Quarter 1/2016, in the notes section no.20. Liabilities from financial lease have increased by 2.84 million baht from purchases of office supplies. Loan settlement in between the installment according to the financial lease of 1.14 million baht has been made.
Current liabilities have increased from the overdraft and short-term loans obtained from financial institutions of 5.44 million Baht; income tax payable has increased by 3.05 million Baht; commercial creditors have decreased by 11.43 million Baht and other creditors have decreased by 21.35 million Baht, according to the repayment schedule.
Shareholder’s equity
As of March 31, 2016, Shareholders’ equity was 332.61 million baht, increase by 9.96 million baht, due to the resulting from net profit.
Emphasis of matter
Attention to the Note 26 to the financial statements for quarter 1/2016, during, the Company found the error due to un-recognition of change in the Company’s ownership interest in subsidiary company (PD Genesis Engineering Co., Ltd). Therefore the Company made an adjustment by increasing the deficit from the change in the ownership interests in the consolidated financial statements amount to 1.54 million baht. As such, the consolidated statements of financial position as at December 31, 2015 and January 1, 2015, of the company which have been presented herewith for comparative purposes, have been restated for the effect of such adjustment.
Cash Flows
Unit: Million Baht
| Cash Flows | March 31, 2016 | March 31, 2015 |
|---|---|---|
| Cashflow from (used in) operating activities | (68.89) | (36.29) |
| Cashflow from (used in) investing activities | (1.71) | (0.81) |
| Cashflow from (used in) financing activities | 49.85 | 29.82 |
| Net increase (decrease) in cash and cash equivalents | (20.75) | (7.27) |
| Cash and cash equivalents at the end of the period | 38.48 | 24.33 |
The Company’s net cash utilized in the operating activities is 68.89 million baht, with operating profits prior to changes in the operating assets and liabilities of 20.56 million Baht. The major reason for the change is due to the completed projects’ values that have not been collected and prepaid expenses to the subcontractors for the construction of the community water supply project of 40.70 million baht. The net remaining inventory has increased by 16.40 million baht due to more projects acquired during the construction of the community water supply project. Also, commercial loans and other types of loans have decreased by 33.20 million baht.
Cash flow utilized in investment activities amounts to 1.71 million baht. 1.5 million baht was disposed of to purchase assets for service provision of the SAFETY Products, and 0.69 million Baht was used to purchase other assets. Loans to employees have increased by 0.60 million baht. Meanwhile, cash flow received from divestment of assets totals 0.93 million baht with interests received of 0.15 million baht.
Cash flow acquired from financing activities amounts to 49.85 million baht; loans from financial institutions have increased by 50 million baht, while overdraft and short-term loans have increased by 5.44 million baht. At the same time, loan repayment to financial institutions amounts to 2.96 million baht and debt settlement according to financial lease of 1.22 million baht was arranged, with an interest expense of 1.68 million baht.
Management Discussion & Analysis (MD&A) Yearly 2015
Overview
In 2015, Consolidated financial statement of Phol Dhanya Public Company Limited (the company) shows revenue from sales and services of 914.90 million baht, increasing by 111.89 million baht or 13.93%, compared with 803.01 million baht of previous year, The increase of revenue is sales of Occupational Safety, Health and Environment Products and revenue from services of Water Treatment Products for both public and private sectors.
However, the company’s selling and administrative expenses were increase amount to 25.03 million baht or 14.62%, so the Company’s consolidate net profit (attributable to owners of the parent) was 34.31 million baht, decreasing by 4.54 million baht or 11.69%, compared with 38.86 million baht of the previous year.
Operating performance
Unit : Million baht
| Y2015 | Y2014 | % YoY | |
|---|---|---|---|
| Revenue from sales | 847.39 | 797.71 | 6.23% |
| Revenue from rendering of services | 67.51 | 5.30 | 1174.28% |
| Other Revenue | 3.04 | 4.48 | -32.15% |
| Total Revenue | 917.94 | 807.49 | 13.68% |
| Cost of sales | 624.78 | 580.99 | 7.54% |
| Cost of rendering of services | 49.84 | 4.18 | 1093.15% |
| Total Costs | 674.62 | 585.17 | 15.29% |
| Gross Profit | 240.29 | 217.85 | 10.30% |
| Gross Profit (%) | 26.26% | 27.13% | -0.86% |
| Total Selling & Administrative Expenses | 196.31 | 171.28 | 14.62% |
| EBIT | 47.02 | 51.05 | -7.90% |
| EBIT (%) | 5.12% | 6.32% | -1.20% |
| Net Profit | 34.31 | 38.86 | -11.69% |
| Net Profit (%) | 3.74% | 4.81% | -1.07% |
| Basic earnings per share (Baht) | 0.21 | 0.24 | -11.69% |
| Weighted average number of ordinary shares (Million shares) | 162.00 | 162.00 |
Revenue
Unit : Million Baht
| Revenue structure | Quarter | Year | |||||||||||
|---|---|---|---|---|---|---|---|---|---|---|---|---|---|
| 4Q 2015 |
% | 4Q 2014* |
% | % YoY |
3Q 2015 |
% | % QoQ |
Y 2015 |
% | Y 2014* |
% | % YoY |
|
| Occupational Safety, Health and Environment Products (SAFETY) | 181.11 | 67% | 170.83 | 84% | 6.01% | 184.31 | 81% | -1.74% | 715.45 | 78% | 675.77 | 84% | 5.87% |
| Control Environment Products (CE) | 28.01 | 10% | 25.10 | 12% | 11.59% | 30.18 | 13% | -7.18% | 104.82 | 11% | 98.11 | 12% | 6.83% |
| Water Treatment Products (WATER) | 61.58 | 23% | 6.49 | 3% | 849.54% | 12.62 | 6% | 388.00% | 94.64 | 10% | 29.13 | 4% | 224.93% |
| Total revenue from sales and services | 270.70 | 100% | 202.42 | 100% | 33.73% | 227.11 | 100% | 19.20% | 914.90 | 100% | 803.01 | 100% | 13.93% |
Note:* The Company had reclassified the type of revenue during SAFETY Products and CE Products, so the revenue structure had changed.
In 2015, the company’s sales and services were 914.90 million baht, increasing by 111.89 million baht or 13.93%, compared with 803.01 million baht of previous year.
Revenue from sales and services of Occupational Safety, Health and Environment Products (SAFETY) were 715.45 million baht, increasing by 39.68 million baht or 5.87%, due to the increase revenue of sales to government sector. In addition, the increase in the revenue was from new products and services to petrochemical industry and from new customers in new areas. However, in general production of each sectors are quite weak in relation to country’s economy, so the revenues from each sectors were quite similar to the previous year while sales in some sectors were decrease.
Revenue from sales of Control Environment Products (CE) were 104.82 million baht, increasing by 6.70 million baht or 6.83%. Main customer of CE products were in electronics industry. Eventhough, some companies had been relocated to other regions and the whole electronic industry had shrunk, revenue from CE sector was still growing as we can keep good potential existing customers.
Revenue from Water Treatment Product (WATER) were 94.64 million baht, increasing by 65.51 million baht or 224.93%, comprised of 31.69 million baht from revenue from sale of Water Treatment systems and equipment and 62.95 million baht from revenue of service, comprised of 5.59 million baht from sale of recycling waste water system and 57.36 million baht from the construction services of water recycling system for both public and private sectors.
Cost of Sales and Services
In 2015, the company’s cost of sales and services amounted to 674.62 million baht comprising of 624.78 million baht of cost of sales and 49.84 million baht of cost of services. Cost of sales and services increase according to increase of revenue from sales and services. Cost of sales and services was accounted for 73.74% of total sales and services revenue, resulting in 26.26% of gross profit margin.
Selling and Administrative Expenses
In 2015, selling and administrative expenses amounted to 196.31 million baht comprised of selling expenses amounted to 101.59 million baht and administrative expenses amounted to 94.04 million baht. Selling expenses was increase due to the increase from revenue from sales. Administrative expenses amounted to 94.04 million baht included loss on impairment of asset 5.93 million baht from the project in Mae Ka.
In 2015, the company’s cost of financial amounted to 4.25 million baht, increasing by 1.60 million baht or 60.41%, due to the increase in short-term loan from financial institution by issuing Bill of Exchange amounted to 100 million baht and promissory note amounted to 40 million baht to support the water treatment business
Net profit
The Company’s consolidate net profit (attributable to owners of the parent) was 34.31 million baht, accounted for net profit margin 3.74%
Financial Position
Unit : Million baht
| Consolidated | December 31, 2015 | December 31, 2014 | % Change | ||
|---|---|---|---|---|---|
| Amount | % | Amount | % | ||
| Assets | 667.40 | 100.00% | 550.37 | 100.00% | 21.26% |
| Liabilities | 346.10 | 51.86% | 229.69 | 41.73% | 50.68% |
| Shareholders' equity | 321.30 | 48.14% | 320.68 | 58.27% | 0.19% |
Assets
As of December 31, 2015, the company’s total assets were 667.40 million baht, which increase by 117.03 million baht or 21.26%, mainly due to the increase in cash and cash equivalent amount to 27.52 million baht, trade account receivable was increase 22.99 million baht unbilled receivables and advance payment to sub-contractors amounted to 39.04 million baht and net inventories was increase 11.63 million baht.
Non-current assets were increase, due to the increase from property, plant and equipment from investment assets and demonstration goods in service center for safety products amount to 16.02 million baht, the building improvements amount to 2.49 million baht and acquisition of new vehicles amount to 5.76 million baht. However, there was disposal of vehicles amount to 4.35 million baht and 14.48 million baht for depreciation and amortization during the period.
Liabilities
The company’s total liabilities as of December 31, 2015, were 346.10 million baht which increase by 116.41 million baht or 50.68%, mainly due to the increase in short-term loan from financial institution amount to 98.18 million baht from bill of exchange and trade payables and other payable were increase 20.16 million baht. Long-term liabilities under finance leases was increase 4.16 million baht from acquisition of new vehicles for operation and employee benefit obligations was increase 2.53 million baht. However, long term loan from financial institutions were decrease 6 million baht.
Shareholders’ equity
As of December 31, 2015, Shareholders’ equity of the company was 321.30 million baht, unappropriated retained earnings was decrease due to the dividend paid amount to 32.40 million baht and the resulting from net profit was 34.31 million baht.
Cash Flow
Unit : Million Baht
| Cash Flow | December 31, 2015 | December 31, 2014 |
|---|---|---|
| Cashflow from (used in) operating activities | (23.21) | 32.37 |
| Cashflow from (used in) investing activities | (4.29) | (2.59) |
| Cashflow from (used in) financing activities | 55.20 | (33.14) |
| Net increase (decrease) in cash and cash equivalents | 2.39 | (44.25) |
| Cash and cash equivalents at the end of the year | 59.14 | 31.62 |
The Company had net cashflow from operating activities amounted to 4.61 million baht in which the profit from operations before change in operating assets and liabilities amounted to 71.21 million baht. Assets and liabilities from operation were changed mainly due to increase in trade and other receivables amounted to 31.91 million baht, unbilled receivable and advance payment to sub-contractors increase 39.04 million baht and increasing in inventories amounted to 15.20 million baht, and trade and other payable were increase by 6.68 million baht.
Cashflow used in investment activities amounted to 4.29 million baht which was cash for acquisition of fixed assets and amounted to 6.20 million baht and additional of leasehold right 0.45 million baht. However, cash inflow were from disposal of assets amount to 1.69 million baht and interest received amount to 0.41 million baht.
Cashflow from financing activities amounted to 55.20 million baht due to the increase in short-term loan from financial institution amounted to 98.18 million baht, repayment of long-term loan amounted to 6 million baht, interest payment amounted to 4.22 million baht and dividend paid amount to 32.40 million baht.
Management Discussion & Analysis (MD&A) Quarter 3/2015
Overview
In Quarter 3/2015, Consolidated financial statement of Phol Dhanya Public Company Limited (the company) shows revenue from sales and services of 227.11 million baht, increasing by 10.68 million baht or 4.93%, compared with 216.43 million baht in the same quarter of previous year, due to the increase from revenue from sales of Occupational Safety, Health and Environment Products and revenue from services of Water Treatment Products were increase, compare with the same quarter of the previous year.
However, the company’s gross profit margin was decrease, due to the increase in cost of sales of imported products caused by the depreciation of baht currency. In addition, sale to government sector which have lower margin were increase. The company’s selling and administrative expenses were increase, due to the increase in loss on impairment of water treatment project, so the Company’s consolidate net profit (attributable to owners of the parent) was 2.61 million baht, decreasing by 10.14 million baht or 75.94%, compared with 12.75 million baht in the same quarter of previous year.
For the nine months period of 2015, The company’s consolidated financial statement shows revenue from sales and services of 644.20 million baht, increasing by 43.61 million baht or 7.26%, compared with 600.59 million baht in the same period of previous year. The company’s consolidate net profit (attributable to owners of the parent) was 18.10 million baht, decreasing by 12.76 million baht or 41.35%, compared with 30.85 million baht in the same period of previous year.
Operating performance
Unit : Million Baht
| Quarter | 9 Months | |||||||
|---|---|---|---|---|---|---|---|---|
| 3Q2015 | 3Q2014 | % YoY | 2Q2015 | % QoQ | Y2015 | Y2014 | % YoY | |
| Revenue from sales | 222.99 | 215.16 | 3.64% | 211.39 | 5.49% | 637.13 | 596.77 | 6.67% |
| Revenue from rendering of services | 4.12 | 1.27 | 224.01% | 1.63 | 152.24% | 7.07 | 3.82 | 85.26% |
| Other Revenue | 0.48 | 1.41 | -66.12% | 1.06 | -54.75% | 2.37 | 3.94 | -39.84% |
| Total Revenue | 227.59 | 214.84 | 4.47% | 214.08 | 6.31% | 646.57 | 604.53 | 6.95% |
| Cost of sales | 166.74 | 157.95 | 5.56% | 152.65 | 9.23% | 467.41 | 435.02 | 7.45% |
| Cost of rendering of services | 3.66 | 0.93 | 291.47% | 1.15 | 219.46% | 5.88 | 2.86 | 105.67% |
| Total Costs | 170.39 | 158.89 | 7.24% | 153.80 | 10.79% | 473.29 | 437.88 | 8.09% |
| Gross Profit | 56.71 | 57.54 | -1.44% | 59.23 | -4.24% | 170.91 | 162.71 | 5.04% |
| Gross Profit (%) | 24.97% | 26.59% | -1.62% | 27.80% | -2.83% | 26.53% | 27.09% | -0.56% |
| Total Selling & Administrative Expenses | 52.19 | 42.32 | 23.30% | 52.20 | -0.03% | 145.52 | 126.53 | 15.01% |
| EBIT | 5.01 | 16.63 | -69.89% | 8.08 | -38.06% | 27.76 | 40.12 | -30.80% |
| EBIT (%) | 2.20% | 7.63% | -5.43% | 3.78% | -1.58% | 4.29% | 6.64% | -2.34% |
| Net Profit | 2.61 | 12.75 | -79.54% | 4.53 | -42.38% | 18.10 | 30.85 | -41.35% |
| Net Profit (%) | 1.15% | 5.85% | -4.71% | 2.11% | -45.80% | 2.80% | 5.10% | -2.30% |
| Basic earnings per share (Baht) | 0.02 | 0.08 | -79.54% | 0.03 | -42.38% | 0.11 | 0.19 | -41.35% |
| Weighted average number of ordinary shares (Million shares) | 162.00 | 162.00 | 162.00 | 162.00 | 162.00 | |||
Revenue
Unit : Million Baht
| Revenue structure | Quarter | 9 Months | |||||||||||
|---|---|---|---|---|---|---|---|---|---|---|---|---|---|
| 3Q 2015 |
% | 3Q 2014* |
% | % YoY |
2Q 2015 |
% | % QoQ |
Y 2015 |
% | Y 2014 |
% | % YoY |
|
| Occupational Safety, Health and Environment Products (SAFETY) | 184.31 | 81% | 177.45 | 82% | 3.81% | 173.26 | 81% | 6.37% | 534.34 | 83% | 504.94 | 84% | 5.82% |
| Control Environment Products (CE) | 30.18 | 13% | 28.79 | 13% | 4.85% | 25.63 | 12% | 17.77% | 76.81 | 12% | 73.01 | 12% | 5.20% |
| Water Treatment Products (WATER) | 12.62 | 6% | 10.10 | 5% | 24.89% | 14.13 | 7% | -10.71% | 33.06 | 5% | 22.64 | 4% | 46.01% |
| Total revenue from sales and services | 227.11 | 100% | 216.43 | 100% | 4.93% | 213.02 | 100% | 6.61% | 644.20 | 100% | 600.59 | 100% | 7.26% |
Note:* The Company had reclassified the type of revenue during SAFETY Products and CE Products, so the revenue structure had changed.
In Quarter 3/2015, the company’s sales were 222.99 million baht, increasing by 7.83 million baht or 3.64%, compared with 215.16 million baht in the same quarter of previous year.
Revenue from sales of Occupational Safety, Health and Environment Products were 184.31 million baht, increasing by 6.77 million baht or 3.81%, due to the revenue from sales to government sector customers were increase. However, in general production of each sectors are quite weak in relation to country’s economy, so the revenues from each sectors were quite similar to the same quarter of the previous year. However, sales in some sectors were decrease.
Revenue from sales of Control Environment Products was 30.18 million baht, slight increasing by 1.40 million baht or 4.85%
Revenue from Water Treatment Product were 12.62 million baht, increasing by 2.52 million baht or 24.89%, comprised of 8.72 million baht from revenue from sale of Water Treatment systems and equipment and 3.90 million baht from revenue of service, comprised of 1.27 million baht from Waste water recycling system services and 2.63 million baht from partial income realization on the community water supply project.
Cost of Sales and Services
In Quarter 3/2015, the company’s cost of sales and services amounted to 170.39 million baht comprising of 166.74 million baht of cost of sales and 3.66 million baht of cost of services. Cost of sales and services increase according to increase of revenue from sales and services. In addition, costs of sales of imported products were increase, due to the depreciation of baht currency. Sales to government sector which have lower margin were also increase. And the community water supply projects have relatively low profit margin, so cost of sales and services was accounted for 75.03% of total sales and services revenue, resulting in 24.97% of gross profit margin.
Selling and Administrative Expenses
In Quarter 3/2015, selling and administrative expenses amounted to 52.19 million baht comprised of selling expenses amounted to 25.95 million baht and administrative expenses amounted to 26.23 million baht. Selling expenses was increase due to the increase from revenue from sales. Administrative expenses amounted to 26.23 million baht comprised of administrative expenses 22.62 million baht and loss on exchange rate 1.03 million baht and loss on impairment of asset 2.58 million baht from the reduction of the size of the water treatment project in Mae Ka.
Net profit
The Company’s consolidate net profit (attributable to owners of the parent) was 2.61 million baht, accounted for net profit margin 1.15%.
Financial Position
Unit : Million Baht
| Consolidated | September 30, 2015 | December 31, 2014 | % Change | ||
|---|---|---|---|---|---|
| Amount | % | Amount | % | ||
| Assets | 586.02 | 100.00% | 550.37 | 100.00% | 6.48% |
| Liabilities | 280.26 | 47.82% | 229.69 | 41.73% | 22.02% |
| Shareholders' equity | 305.76 | 52.18% | 320.68 | 58.27% | -4.65% |
Assets
As of September 30, 2015, the company’s total assets were 586.02 million baht, which increase by 35.65 million baht or 6.48%, mainly due to the increase in trade account receivable amount to 12.88 million baht and other receivable decrease from the impairment of asset amount to 5.15 million baht , due to the reduction of the size of the water treatment project in Mae ka.
Non-current assets were increase, due to the increase from property, plant and equipment from investment in service center for safety products amount to 14.91 million baht, the building improvements amount to 1.8 million baht and vehicles amount to 2.9 million baht, However, non-current assets were decrease by 8.69 million baht from depreciation and amortization during the period.
Liabilities
The company’s total liabilities as of September 30, 2015, were 280.26 million baht which increase by 50.57 million baht or 22.02%, mainly due to the increase in short-term loan from financial institution amount to 67.46 million baht for loan repayment and investment in fixed assets, However, trade payables and other payable were decrease 14.93 million baht and long term loan from financial institutions were decrease 4.5 million baht.
Shareholders’ equity
As of September 30, 2015, Shareholders’ equity of the company was 305.76 million baht, unappropriated retained earnings was decrease due to the dividend paid amount to 32.40 million baht and the resulting from net profit was 18.10 million baht.
Cash Flow
Unit : Million Baht
| Cash Flow | September 30, 2015 | September 30, 2014 |
|---|---|---|
| Cashflow from (used in) operating activities | (4.61) | 5.87 |
| Cashflow from (used in) investing activities | (21.15) | (2.26) |
| Cashflow from (used in) financing activities | 28.15 | (33.14) |
| Net increase (decrease) in cash and cash equivalents | 2.39 | (18.42) |
| Cash and cash equivalents at the end of the year | 33.87 | 27.64 |
The Company had net cashflow from operating activities amounted to 4.61 million baht in which the profit from operations before change in operating assets and liabilities amounted to 45.74 million baht. Assets and liabilities from operation were changed mainly due to increase in trade and other receivables amounted to 24.20 million baht, increase in inventories amounted to 1.05 million baht, however, trade and other payable were decrease by 12.45 million baht.
Cashflow used in investment activities amounted to 21.15 million baht which was cash for acquisition of fixed assets and computer software amounted to 20.74 million baht and interest received amount to 0.29 million baht.
Cashflow from financing activities amounted to 28.15 million baht due to short-term loan from financial institution amounted to 67.49 million baht, repayment of long-term loan amounted to 4.5 million baht, interest payment amounted to 2.78 million baht and dividend paid amount to 32.40 million baht.
Management Discussion & Analysis (MD&A) Quarter 2/2015
Overview
In Quarter 2/2015, Consolidated financial statement of Phol Dhanya Public Company Limited (the Company) shows revenue from sales and services of 213.02 million baht, increasing by 28.59 million baht or 15.50%, compared with 184.43 million baht in the same quarter of previous year, due to the revenue from sales of Occupational Safety, Health and Environment Products were increase by the petrochemical sector and government sector customers. In addition, the revenue from sales of Water Treatment Products were increase, compare with the same quarter of the previous year. However, the Company’s selling and administrative expenses were increase, so the Company’s consolidate net profit (attributable to owners of the parent) was 4.53 million baht, decreasing by 2.06 million baht or 31.23%, compared with 6.58 million baht in the same quarter of previous year.
For the six months period of 2015, The company’s consolidated financial statement shows revenue from sales and services of 417.09 million baht, increasing by 32.93 million baht or 8.57%, compared with 384.16 million baht in the same period of previous year. The Company’s consolidate net profit (attributable to owners of the parent) was 15.49 million baht, decreasing by 2.62 million baht or 14.46%, compared with 18.11 million baht in the same period of previous year.
Operating performance
Unit : Million Baht
| Quarter | 6 Months | |||||||
|---|---|---|---|---|---|---|---|---|
| 2Q2015 | 2Q2014 | % YoY | 1Q2015 | % QoQ | Y2015 | Y2014 | % YoY | |
| Revenue from sales | 211.39 | 183.10 | 15.45% | 202.75 | 4.26% | 414.14 | 381.62 | 8.52% |
| Revenue from rendering of services | 1.63 | 1.33 | 22.68% | 1.32 | 23.43% | 2.95 | 2.55 | 16.03% |
| Other Revenue | 1.06 | 0.47 | 124.79% | 3.23 | -67.28% | 1.91 | 2.53 | -24.38% |
| Total Revenue | 214.08 | 184.90 | 15.78% | 207.30 | 3.27% | 419.01 | 386.69 | 8.36% |
| Cost of sales | 152.65 | 133.88 | 14.03% | 148.02 | 3.13% | 300.67 | 277.07 | 8.52% |
| Cost of rendering of services | 1.15 | 0.89 | 29.10% | 1.08 | 6.02% | 2.23 | 1.93 | 15.53% |
| Total Costs | 153.80 | 134.76 | 14.12% | 149.10 | 3.15% | 302.90 | 278.99 | 8.57% |
| Gross Profit | 59.23 | 49.67 | 19.24% | 54.98 | 7.73% | 114.20 | 105.17 | 8.58% |
| Gross Profit (%) | 27.80% | 26.93% | 0.87% | 26.94% | 0.86% | 27.38% | 27.38% | 0.00% |
| Total Selling & Administrative Expenses | 52.20 | 41.43 | 25.99% | 43.53 | 19.90% | 93.36 | 84.21 | 10.86% |
| EBIT | 8.08 | 8.71 | -7.19% | 14.67 | -44.91% | 22.75 | 23.49 | -3.13% |
| EBIT (%) | 3.78% | 4.71% | -0.93% | 7.08% | -3.30% | 5.43% | 6.07% | -0.64% |
| Net Profit | 4.53 | 6.58 | -31.23% | 10.96 | -58.70% | 15.49 | 18.11 | -14.46% |
| Net Profit (%) | 2.11% | 3.56% | -1.45% | 5.29% | -60.00% | 3.70% | 4.68% | -0.99% |
| Basic earnings per share (Baht) | 0.03 | 0.04 | -31.23% | 0.07 | -58.70% | 0.10 | 0.11 | -14.46% |
| Weighted average number of ordinary shares (Million shares) | 162.00 | 162.00 | 162.00 | 162.00 | 162.00 | |||
Revenue
Unit : Million Baht
| Revenue structure | Quarter | 6 Months | |||||||||||
|---|---|---|---|---|---|---|---|---|---|---|---|---|---|
| 2Q 2015 |
% | 2Q 2014* |
% | % YoY |
1Q 2015 |
% | % QoQ |
Y 2015 |
% | Y 2014 |
% | % YoY |
|
| Occupational Safety, Health and Environment Products (SAFETY) | 173.12 | 81% | 152.02 | 82% | 13.87% | 176.69 | 87% | -2.02% | 349.80 | 84% | 327.40 | 85% | 6.84% |
| Control Environment Products (CE) | 25.63 | 12% | 26.97 | 15% | -4.97% | 21.00 | 10% | 22.06% | 46.62 | 11% | 44.23 | 12% | 5.42% |
| Water Treatment Products (WATER) | 14.28 | 7% | 5.44 | 3% | 162.51% | 6.39 | 3% | 123.48% | 20.67 | 5% | 12.54 | 3% | 64.86% |
| Total revenue from sales and services | 213.02 | 100% | 184.43 | 100% | 15.50% | 204.07 | 100% | 4.39% | 417.09 | 100% | 384.16 | 100% | 8.57% |
Note:* The Company had reclassified the type of revenue during SAFETY Products and CE Products, so the revenue structure had changed.
In Quarter 2/2015, the Company’s sales were 213.02 million baht, increasing by 28.59 million baht or 15.50%, compared with 184.43 million baht in the same quarter of previous year.
Revenue from sales of Occupational Safety, Health and Environment Products were 173.12 million baht, increasing by 21.09 million baht or 13.87%, due to the revenue from sales to the petrochemical sector and government sector customers were increase. However, in general production of each sectors are quite weak in relation to country’s economy, so the revenues from each sectors to decline.
Revenue from sales of Control Environment Products was 25.63 million baht, increasing by 1.34 million baht or 4.97%
Revenue from Water Treatment Product were 14.28 million baht, increasing by 8.84 million baht or 162.51%, comprised of 1.63 million baht from revenue from Waste water recycling system services and 12.65 million baht from revenue from sale of Water Treatment systems and equipment. Majority of sales are to industrial customers which increase from the same quarter of previous year.
Other revenues were 1.06 million baht from rental income and other income.
Cost of Sales and Services
In Quarter 2/2015, the Company’s cost of sales and services amounted to 153.80 million baht comprising of 152.65 million baht of cost of sales and 1.15 million baht of cost of services. Cost of sales and services increase according to increase of revenue from sales and services. Cost of sales and services was accounted for 72.20% of total sales and services revenue, resulting in 27.80% of gross profit margin.
Selling and Administrative Expenses
In Quarter 2/2015, selling and administrative expenses amounted to 52.20 million baht comprised of selling expenses amounted to 26.01 million baht and administrative expenses amounted to 26.19 million baht. Selling expenses was increase due to the increase from revenue from sales. Administrative expenses amounted to 26.19 million baht comprised of administrative expenses 21.24 million baht and loss on exchange rate 2.38 million baht and loss on impairment of asset 2.58 million baht from the reduction of the size of the water treatment project in Mae Ka.
Net profit
The Company’s consolidate net profit (attributable to owners of the parent) was 4.53 million baht, accounted for net profit margin 2.11%.
Financial Position
Unit : Million Baht
| Consolidated | June 30, 2015 | December 31, 2014 | % Change | ||
|---|---|---|---|---|---|
| Amount | % | Amount | % | ||
| Assets | 565.60 | 100.00% | 550.37 | 100.00% | 2.77% |
| Liabilities | 249.27 | 44.07% | 229.69 | 41.73% | 8.52% |
| Shareholders' equity | 316.33 | 55.93% | 320.68 | 58.27% | -1.36% |
Assets
As of June 30, 2015, the Company’s total assets were 565.60 million baht, which increase by 15.23 million baht or 2.77%, mainly due to the increase in trade account receivable amount to 9.35 million baht and inventories increase amount to 3.82 million baht and cash and cash equivalent increase amount to 3.33 million baht. Other receivable decrease from the impairment of asset amount to 2.58 million baht due to the reduction of the size of the water treatment project in Mae ka.
Non-current assets were increase, due to the building improvements amount to 1.8 million baht and Vehicles amount to 2.9 million baht, However, non-current assets were decrease by 6.49 million baht from depreciation and amortization during the period.
Liabilities
The Company’s total liabilities as of June 30, 2015, were 249.27 million baht which increase by 19.58 million baht or 8.52%, mainly due to the increase in short-term loan from financial institution amount to 50.71 million baht, However trade payables and other payable were decrease 30.74 million baht.
Shareholders’ equity
As of June 30, 2015, Shareholders’ equity of the company was 318.95 million baht, unappropriated retained earnings was decrease due to the dividend paid amount to 19.44 million baht and the resulting from net profit was 15.49 million baht.
Cash Flow
Unit : Million Baht
| Cash Flow | June 30, 2015 | June 30, 2014 |
|---|---|---|
| Cashflow from (used in) operating activities | (17.85) | 1.55 |
| Cashflow from (used in) investing activities | (5.06) | (2.15) |
| Cashflow from (used in) financing activities | 26.26 | (21.86) |
| Net increase (decrease) in cash and cash equivalents | 3.35 | (22.46) |
| Cash and cash equivalents at the end of the year | 34.95 | 23.63 |
The Company had net cashflow from operating activities amounted to 17.85 million baht in which the profit from operations before change in operating assets and liabilities amounted to 35.29 million baht. Assets and liabilities from operation were changed mainly due to increase in trade and other receivables amounted to 10.01 million baht, increase in inventories amounted to 4.98 million baht, however, trade and other payable were decrease by 31.64 million baht.
Cashflow used in investment activities amounted to 5.06 million baht which was cash for acquisition of fixed assets and computer software amounted to 5.16 million baht and interest received amount to 0.20 million baht.
Cashflow from financing activities amounted to 26.26 million baht due to short-term loan from financial institution amounted to 50.46 million baht, repayment of long-term loan amounted to 3 million baht, interest payment amounted to 1.7 million baht and dividend paid amount to 19.44 million baht.
Management Discussion & Analysis (MD&A) Quarter 1/2015
Overview
In Quarter 1/2015, Consolidated financial statement of Phol Dhanya Public Company Limited (the Company) shows revenue from sales and services of 204.07 million baht, increasing by 4.34 million baht or 2.17%, compared with 199.73 million baht in the same quarter of previous year, Revenue from sales increase slightly due to the overall economy, overall industry of domestic and aboard are slowdown.
The Company’s consolidate net profit (attributable to owners of the parent) was 10.96 million baht, decreasing by 0.56 million baht or 4.88%, compared with 11.52 million baht in the same quarter of previous year.
Operating performance
Unit : Million Baht
| 1Q2015 | 1Q2014 | % Change | 4Q2014 | % Change | |
|---|---|---|---|---|---|
| Revenue from sales | 202.75 | 198.52 | 2.13% | 200.94 | 0.90% |
| Revenue from rendering of services | 1.32 | 1.22 | 8.75% | 1.48 | -10.79% |
| Other Revenue | 3.23 | 2.06 | 57.01% | 0.54 | 497.51% |
| Total Revenue | 207.30 | 201.79 | 2.73% | 202.96 | 2.14% |
| Cost of sales | 148.02 | 143.19 | 3.37% | 145.97 | 1.40% |
| Cost of rendering of services | 1.08 | 1.04 | 3.94% | 1.32 | -17.93% |
| Total Costs | 149.10 | 144.23 | 3.38% | 147.29 | 1.23% |
| Gross Profit | 54.98 | 55.50 | -0.95% | 55.13 | -0.28% |
| Gross Profit (%) | 26.94% | 27.79% | -0.85% | 27.24% | -0.30% |
| Total Selling & Administrative Expenses | 43.53 | 42.78 | 1.76% | 44.74 | -2.70% |
| EBIT | 14.67 | 14.78 | -0.74% | 10.93 | 34.26% |
| EBIT (%) | 7.08% | 7.32% | -0.25% | 5.38% | 1.69% |
| Net Profit | 10.96 | 11.52 | -4.88% | 8.00 | 36.99% |
| Net Profit (%) | 5.29% | 5.71% | -0.42% | 3.94% | 34.12% |
| Basic earnings per share (Baht) | 0.07 | 0.07 | -4.88% | 0.05 | 36.99% |
| Weighted average number of ordinary shares (Million shares) | 162.00 | 162.00 | 162.00 |
Revenue
Unit : Million Baht
| Revenue structure | 1Q2015 | % | 1Q2014* | % | % Change |
|---|---|---|---|---|---|
| Occupational Safety, Health and Environment Products (SAFETY) | 176.69 | 87% | 175.38 | 88% | 0.75% |
| Control Environment Products (CE) | 21.00 | 10% | 17.26 | 9% | 21.65% |
| Water Treatment Products (WATER) | 6.39 | 3% | 7.10 | 4% | -9.97% |
| Total revenue from sales and services | 204.07 | 100% | 199.73 | 100% | 2.17% |
Note:* The Company had reclassified the type of revenue during SAFETY Products and CE Products, so the revenue structure had changed.
The Company’s sales were 202.75 million baht, increasing by 4.23 million baht or 2.13%, compared with 198.52 million baht in the same quarter of previous year.
Revenue from sales of Occupational Safety, Health and Environment Products were 176.69 million baht, revenue increased slightly due to the manufacturing of most industry sector have been stabilizing. In quarter 1/2015, revenue from sales of petrochemical sector and government sector are increased, while, revenue from other sectors such as automotive sector and food sector have the same balance, compare to the same quarter of the previous year.
Revenue from sales of Control Environment Products was 21 million baht, increasing by 3.74 million baht or 21.65%, the major customers in electronic sector were increase in quarter 1/2015.
Revenue from Water Treatment Product were 6.39 million baht, comprised of 1.32 million baht from revenue from Waste water recycling system services and 5.07 million baht from revenue from sale of Water Treatment systems and equipment, which mainly sold to industrial customers.
Other revenues were 3.23 million baht, comprised of 2.40 million baht from gain on exchange rate and 0.83 million baht from rental income and other income.
Cost of Sales and Services
In Quarter 1/2015, the Company’s cost of sales and services amounted to 149.10 million baht comprising of 148.02 million baht of cost of sales and 1.08 million baht of cost of services. Cost of sales and services was accounted for 73.06% of total sales and services revenue, resulting in 26.94% of gross profit margin. The decrease of gross profit margin was due to an increase of sales of low gross profit margin products.
Selling and Administrative Expenses
In Quarter 1/2015, selling and administrative expenses amounted to 43.53 million baht comprised of selling expenses amounted to 21.73 million baht and administrative expenses amounted to 21.80 million baht. Selling and administrative expenses were increase mainly due to the increase of personnel expenses.
Net profit
The Company’s consolidate net profit (attributable to owners of the parent) was 10.96 million baht, accounted for net profit margin 5.29%
Financial Position
Unit : Million Baht
| Consolidated | March 31, 2015 | December 31, 2014 | % Change | ||
|---|---|---|---|---|---|
| Amount | % | Amount | % | ||
| Assets | 565.56 | 100.00% | 550.37 | 100.00% | 2.76% |
| Liabilities | 234.20 | 41.41% | 229.69 | 41.73% | 1.96% |
| Shareholders' equity | 331.37 | 58.59% | 320.68 | 58.27% | 3.33% |
Assets
As of March 31, 2015, the Company’s total assets were 565.56 million baht, which increase by 15.19 million baht or 2.76%, mainly due to the increase in trade account receivable amount to 11.25 million baht and inventories increase amount to 13.38 million baht. However, cash and cash equivalent were decrease by 7.27 million baht. And non-current assets were decrease, due to the deduction of depreciation amounted to 3.22 million baht.
Liabilities
The Company’s total liabilities as of March 31, 2015, were 234.2 million baht which increase by 4.51 million baht or 1.96%, mainly due to the increase in short-term loan (Trust receipt) from financial institution amount to 32 million baht and current income tax payable was increase 3.3 million baht. However trade payables and other payable were decrease 30.07 million baht.
Shareholders' equity
As of March 31, 2015, Shareholders’ equity was 331.37 million baht, increase by 10.69 million baht from the previous year, due to the resulting from net profit.
Cash Flow
Unit : Million Baht
| Cash Flow | March 31, 2015 | March 31, 2014 |
|---|---|---|
| Cashflow from (used in) operating activities | (36.29) | (9.67) |
| Cashflow from (used in) investing activities | (0.81) | (1.98) |
| Cashflow from (used in) financing activities | 29.82 | (9.60) |
| Net increase (decrease) in cash and cash equivalents | (7.27) | (21.25) |
| Cash and cash equivalents at the end of the year | 24.33 | 24.84 |
The Company had net cashflow from operating activities amounted to 36.29 million baht in which the profit from operations before change in operating assets and liabilities amounted to 17.61 million baht. Assets and liabilities from operation were changed mainly due to increase in trade and other receivables amounted to 11.07 million baht, increase in inventories amounted to 13.56 million baht, however, trade and other payable were decrease by 29.06 million baht.
Cashflow used in investment activities amounted to 0.81 million baht which was cash for acquisition of fixed assets and computer software
Cashflow used in financing activities amounted to 29.82 million baht due to short-term loan from financial institution amounted to 32.15 million baht, repayment of long-term loan amounted to 1.5 million baht and interest payment amounted to 0.8 million baht.
The Company’s cash and cash equivalents as of March 31, 2015 was 24.33 million baht decrease by 0.51 million baht compared with March 31, 2014.
Management Discussion & Analysis (MD&A) Yearly 2014
Operating performance
unit : million baht
| Y2014 | Y2013 | % Change | |
|---|---|---|---|
| Revenue from sales | 797.71 | 769.09 | 3.72% |
| Revenue from rendering of services | 5.30 | 4.79 | 10.63% |
| Other Revenue | 4.48 | 2.79 | 60.32% |
| Total Revenue | 807.49 | 776.67 | 3.97% |
| Cost of sales | 580.99 | 536.36 | 8.32% |
| Cost of rendering of services | 4.18 | 3.71 | 12.47% |
| Total Costs | 585.17 | 540.08 | 8.35% |
| Gross Profit | 217.85 | 233.80 | -6.82% |
| Gross Profit (%) | 27.13% | 30.21% | -3.08% |
| Total Selling & Administrative Expenses | 171.28 | 168.91 | 1.40% |
| EBIT | 51.05 | 67.69 | -24.58% |
| EBIT (%) | 6.32% | 8.72% | -2.39% |
| Net Profit | 38.86 | 50.75 | -23.43% |
| Net Profit (%) | 4.81% | 6.53% | -1.72% |
| Basic earnings per share (Baht) | 0.24 | 0.31 | -23.43% |
| Weighted average number of ordinary shares (Million shares) | 162.00 | 162.00 |
Revenue
unit : million baht
| Revenue structure | Y2014 | % | Y2013 | % | % Change |
|---|---|---|---|---|---|
| Occupational safety, health and environment products | 668.82 | 83% | 638.20 | 82% | 4.80% |
| Control environment products | 105.11 | 13% | 105.71 | 14% | -0.57% |
| Water treatment products | 29.08 | 4% | 29.97 | 4% | -2.98% |
| Total revenue from sales and services | 803.01 | 100% | 773.88 | 100% | 3.76% |
In 2014, the Company’s consolidated revenue from sales and services were 803.01 million baht, increase by 29.13 million baht (3.76% YoY), compared with 773.88 million baht in the previous year.
The Company’s sales were 797.71 million baht, increase by 28.62 million baht (3.72% YoY) compared with 769.09 million baht in the previous year, The revenue from sales of Occupational Safety, Health and Environment Products increase from sales of Petrochemical segment and Government and State enterprise segment. However, some major customers such as Automotive segment and Food segment were decrease from economic slowdown.
Revenue from sales of Control Environment Products mainly came from Electronic segment, which had similar amount compare to the previous year.
Revenue from Water Treatment Product were 29.08 million baht, comprised of 5.30 million baht from revenue from services and 23.78 million baht from revenue from sale from Water Treatment systems and equipment.
Other revenues were 4.48 million baht, comprised of 2.06 million baht from gain on exchange rate and 2.42 million baht from rental income and other income.
Cost of Sales and Services
In 2014, the Company’s cost of sales and services amounted to 583.85 million baht comprising of 579.67 million baht of cost of sales and 4.18 million baht of cost of services. Cost of sales and services was accounted for 72.71% of total sales and services revenue, resulting in 27.29% of gross profit margin, which decrease from 30.21% in the previous year. The decrease of gross profit margin was due to an increase of sales of low gross profit margin products to both government sector and state enterprises customers, which mainly sale offer in the auction.
Selling and Administrative Expenses
In 2014, selling and administrative expenses amounted to 171.28 million baht comprised of selling expenses amounted to 88.09 million baht and administrative expenses amounted to 83.19 million baht. The increase of selling and administrative expenses mainly due to the increase in selling and administrative of subsidiaries, which were personnel expenses.
Net profit
The Company’s net profit after minority interest was 38.86 million baht accounted for net profit margin 4.81%, decrease by 11.89 million baht (23.43% YoY) compared with 50.75 million baht accounted for net profit margin 6.53% in the previous year, due to an increase of sales of low gross profit margin products.
Financial Position
unit : million baht
| Consolidated | December 31, 2014 | December 31, 2013 | % Change | ||
|---|---|---|---|---|---|
| million baht | % | million baht | % | ||
| Assets | 550.37 | 100.00% | 511.45 | 100.00% | 7.61% |
| Liabilities | 229.69 | 41.73% | 202.75 | 39.64% | 13.28% |
| Shareholders' equity | 320.68 | 58.27% | 308.70 | 60.36% | 3.88% |
Assets
As of December 31, 2014, the Company’s total assets were 550.37 million baht, which increase by 39.98 million baht (7.82% YoY) from the previous year, mainly due to the increase in trade account receivable amount to 24.58 million baht and other receivable increase from prepaid expense amount to 7.98 million baht. Inventories increase amount to 27.89 million baht, due to support sales in next quarter.
Liabilities
The Company’s total liabilities as of December 31, 2014 were 229.69 million baht which increase by 26.94 million baht (5.10% YoY) from the previous year, mainly due to the increase in trade payables 46.74 million baht from increase stock for support sales next quarter. Other payable was decrease 9.06 million baht and bank overdrafts and short-term loan from financial institution was decrease 9.58 million baht.
Shareholders' equity
As of December 31, 2014, Shareholders’ equity was 320.68 million baht, increase by 11.98 million baht (3.88% YoY) from the previous year, due to the resulting from net profit amount to 38.86 million baht and increase in registered capital 27 million shares for stock dividend and paid cash dividend amount to 26.45 million baht.
Management Discussion & Analysis (MD&A) Quarter 3/2014
Operating performance
unit : million baht
| 3Q2014 | 3Q2013 | % Change | 2Q2014 | % Change | 9 M /2014 |
9 M /2013 |
% Change | |
|---|---|---|---|---|---|---|---|---|
| Revenue from sales | 215.16 |
186.37 |
15.45% |
183.10 |
17.51% |
596.77 |
574.16 |
3.94% |
| Revenue from rendering of services | 1.27 |
1.25 |
1.61% |
1.33 |
-4.49% |
3.82 |
3.52 |
8.47% |
| Other Revenue | 1.41 |
1.30 |
8.86% |
0.47 |
200.18% |
3.94 |
2.40 |
63.97% |
| Total Revenue | 217.84 |
188.91 |
15.31% |
184.90 |
17.81% |
604.53 |
580.08 |
4.22% |
| Cost of sales | 157.95 |
128.04 |
23.36% |
133.88 |
17.98% |
435.02 |
401.09 |
8.46% |
| Cost of rendering of services | 0.93 |
-0.02 |
-4795.88% |
0.89 |
5.36% |
2.86 |
2.24 |
27.79% |
| Total Costs | 158.89 |
128.02 |
24.11% |
134.76 |
17.90% |
437.88 |
403.32 |
8.57% |
| Gross Profit | 57.54 |
59.60 |
-3.45% |
49.67 |
15.85% |
162.71 |
174.35 |
-6.67% |
| Gross Profit (%) | 26.59% |
31.77% |
-5.18% |
26.93% |
-0.34% |
27.09% |
30.18% |
-3.09% |
| Total Selling & Administrative Expenses | 42.32 |
42.76 |
-1.02% |
41.43 |
2.16% |
126.53 |
119.74 |
5.67% |
| EBIT | 16.63 |
18.13 |
-8.29% |
8.71 |
90.96% |
40.12 |
57.01 |
-29.63% |
| EBIT (%) | 7.63% |
9.60% |
-1.96% |
4.71% |
2.92% |
6.64% |
9.83% |
-3.19% |
| Net Profit | 12.75 |
13.10 |
-2.72% |
6.58 |
93.64% |
30.85 |
42.95 |
-28.16% |
| Net Profit (%) | 5.85% |
6.94% |
-1.08% |
3.56% |
64.36% |
5.10% |
7.40% |
-2.30% |
| Basic earnings per share (Baht)* | 0.08 |
0.08 |
-2.72% |
0.04 |
93.64% |
0.19 |
0.27 |
-28.16% |
| Weighted average number of ordinary shares (Million shares) * | 162.00 |
162.00 |
162.00 |
162.00 |
162.00 |
Revenue
unit : million baht
| Revenue structure | 3Q2014 | % | 3Q2013 | % | % Change | 9 M/2014 | % | 9 M/2013 | % Change |
|---|---|---|---|---|---|---|---|---|---|
| Occupational safety, health and environment products | 181.58 |
84% |
159.62 |
85% |
13.76% |
495.08 |
82% |
473.83 |
4.49% |
| Control environment products | 24.92 |
12% |
23.25 |
12% |
7.17% |
83.14 |
14% |
82.34 |
0.97% |
| Water treatment products | 9.93 |
5% |
4.75 |
3% |
109.21% |
22.37 |
4% |
21.51 |
4.02% |
| Total revenue from sales and services | 216.43 |
100% |
187.62 |
100% |
15.36% |
600.59 |
100% |
577.67 |
3.97% |
In quarter 3/2014, the Company's consolidated revenue from sales and services were 216.43 million baht, increase by 28.82 million baht (15.36% YoY), compared with 187.62 million baht in the same quarter of previous year.
The Company's sales were 215.16 million baht, increase by 28.79 million baht (15.45% YoY) compared with 186.37 million baht in the same quarter of previous year, Major revenue from sales of Occupational safety, health and environment products, especially, the increase from revenue from sales of the personal protective equipment to Petrochemical segment and Construction segment customers, which increase according to industrial expansion, compare with the same quarter of previous year. In addition, the company has added new products to sell to petrochemical industry customers.
In addition, Sales from government and state enterprises customer were increase. However, revenue from other major industrial customers was decrease, such as, automotive segment, food segment and electronic segment, according to the country economy slowdown.
Cost of Sales and Services
In quarter 3/2014, the Company's cost of sales and services amounted to 158.89 million baht comprising of 157.95 million baht of cost of sales and 0.93 million baht of cost of services. Cost of sales and services was accounted for 73.41% of total sales and services revenue, resulting in 26.59% of gross profit margin, which decrease from 31.77% in the same quarter of previous year. The decrease of gross profit margin was due to an increase of sales of low gross profit margin products to both government sector and state enterprises customers. In addition, in quarter 3/2014, cost of services had negative balance, due to the reversal of impairment assets transaction.
Selling and Administrative Expenses
In quarter 3/2014, selling and administrative expenses amounted to 42.32 million baht comprised of selling expenses amounted to 22.49 million baht and administrative expenses amounted to 19.84 million baht. Mainly selling and administrative expenses were personnel expenses, which had similar amount, compared to the same quarter of the previous year.
Net profit
The Company's net profit after minority interest was 12.75 million baht accounted for net profit margin 5.85%, decrease by 0.35 million baht (2.72% YoY) compared with 13.10 million baht accounted for net profit margin 6.94% in the same quarter of previous year, due to an increase of sales of low gross profit margin products.
Financial Position
| Consolidated | September 30, 2014 | December 31, 2013 | % Change | ||
|---|---|---|---|---|---|
| million baht | % | million baht | % | ||
| Assets | 505.28 |
100.00% |
511.45 |
100.00% |
-1.21% |
| Liabilities | 192.40 |
38.08% |
202.75 |
39.64% |
-5.10% |
| Shareholders' equity | 312.88 |
61.92% |
308.70 |
60.36% |
1.35% |
Assets
As of September 30, 2014, the Company's total assets were 505.28 million baht, which decrease by 6.17 million baht (1.21% YoY) from the previous year, mainly due to the decrease in cash and cash equivalent by 18.48 million baht and inventories decrease amount to 19.06 million baht.
Trade and other receivable increase 35.27 million baht, mainly due to increase in trade accounts receivable, and other receivable which increase from prepaid expenses and refundable import duty.
Liabilities
The Company's total liabilities as of September 30, 2014 were 192.40 million baht which decrease by 5.10% from the previous year, mainly due to the decrease in trade and other payable were increase 5.81 million baht and long term loan from financial institutions was decrease 4.5 million baht.
Shareholders' equity
As of September 30, 2014, Shareholders' equity was 312.88 million baht, increase by 4.18 million baht (1.35% YoY) from the previous year.
Management Discussion & Analysis (MD&A) Quarter 2/2014
Operating performance
unit : million baht
| 2Q2014 | 2Q2013 | % Change | 1Q2014 | % Change | 6 M /2014 |
6 M /2013 |
% Change | |
|---|---|---|---|---|---|---|---|---|
| Revenue from sales | 183.10 |
195.19 |
-6.19% |
198.52 |
-7.77% |
381.62 |
387.79 |
-1.59% |
| Revenue from rendering of services | 1.33 |
1.25 |
6.18% |
1.22 |
9.42% |
2.55 |
2.27 |
12.25% |
| Other Revenue | 0.47 |
0.53 |
-10.46% |
201.79 |
-77.14% |
2.53 |
1.15 |
120.32% |
| Total Revenue | 184.90 |
196.97 |
-6.13% |
201.79 |
-8.37% |
386.69 |
391.21 |
-1.15% |
| Cost of sales | 133.88 |
135.25 |
-1.02% |
143.19 |
-6.51% |
277.07 |
273.05 |
1.47% |
| Cost of rendering of services | 0.89 |
1.31 |
-32.46% |
1.04 |
-14.65% |
1.93 |
2.26 |
-14.71% |
| Total Costs | 134.76 |
136.56 |
-1.32% |
144.23 |
-6.56% |
278.99 |
275.31 |
1.34% |
| Gross Profit | 49.67 |
59.88 |
-17.06% |
55.50 |
-10.51% |
105.17 |
114.75 |
-8.35% |
| Gross Profit (%) | 26.93% |
30.48% |
-3.55% |
27.79% |
-0.86% |
27.38% |
29.42% |
-2.04% |
| Total Selling & Administrative Expenses | 41.43 |
42.22 |
-1.87% |
42.78 |
-3.16% |
84.21 |
77.02 |
9.33% |
| EBIT | 8.71 |
18.19 |
-52.11% |
14.78 |
-41.08% |
23.49 |
38.88 |
-39.58% |
| EBIT (%) | 4.71% |
9.23% |
-4.52% |
7.32% |
-2.62% |
6.07% |
9.94% |
-3.86% |
| Net Profit | 6.58 |
14.10 |
-53.31% |
11.52 |
-42.87% |
18.11 |
29.84 |
-39.33% |
| Net Profit (%) | 3.56% |
7.16% |
-3.60% |
5.71% |
-37.65% |
4.68% |
7.63% |
-2.95% |
| Basic earnings per share (Baht)* | 0.04 |
0.09 |
-53.31% |
0.07 |
-42.87% |
0.11 |
0.18 |
-39.33% |
| Weighted average number of ordinary shares (Million shares) * | 162.00 |
162.00 |
162.00 |
162.00 |
162.00 |
*Restated
Revenue
unit : million baht
| Revenue structure | 2Q2014 | 2Q2013 | % Change | 6 M/2014 | 6 M/2013 | % Change |
|---|---|---|---|---|---|---|
| Occupational safety, health and environment products | 150.15 |
160.69 |
-6.56% |
313.50 |
314.21 |
-0.22% |
| Control environment products | 28.94 |
28.13 |
2.89% |
58.22 |
59.09 |
-1.47% |
| Water treatment products | 5.34 |
7.63 |
-29.93% |
12.44 |
16.76 |
-25.77% |
| Total revenue from sales and services | 184.43 |
196.44 |
-6.12% |
384.16 |
390.06 |
-1.51% |
In quarter 2/2014, the Company's consolidated revenue from sales and services were 184.43 million baht, decrease by 12.01 million baht (6.12% YoY), compared with 196.44 million baht in the same quarter of previous year.
The Company's sales were 183.10 million baht, decreased by 12.09 million baht (6.19% YoY) compared with 195.19 million baht in the same quarter of previous year, due to the decrease sales of occupational safety, health and environment products, consistent with the decline of industrial sectors especially automobile industry. In addition, revenues from sales and services of water treatment products do not meet the target.
Cost of Sales and Services
In quarter 2/2014, the Company's cost of sales and services amounted to 134.76 million baht comprising of 133.88 million baht of cost of sales and 0.89 million baht of cost of services. Cost of goods sold decrease because of volume sales decrease. Cost of services decrease because of more efficiency in cost management, compare to the same quarter of the previous year
In quarter 2/2014, Cost of sales and services was accounted for 73.07% of total sales and services revenue, resulting in 26.93% of gross profit margin, which decrease from 30.48% in the same quarter of previous year. The decrease of gross profit margin was due to an increase of sales of low gross profit margin products to both government and private sectors.
Selling and Administrative Expenses
In quarter 2/2014, selling and administrative expenses amounted to 41.43 million baht comprised of selling expenses amounted to 22 million baht and administrative expenses amounted to 19.43 million baht. The increase of selling expenses was mainly due to increase in selling expenses from new subsidiaries. Administrative expenses are about the same amount as the same quarter of the previous year.
Net profit
The Company's net profit after minority interest was 6.58 million baht accounted for net profit margin 3.56%, decrease by 7.52 million baht (53.31% YoY) compared with 14.10 million baht accounted for net profit margin 7.16% in the same quarter of previous year.
Financial Position
| Consolidated | June 30, 2014 | December 31, 2013 | % Change | ||
|---|---|---|---|---|---|
| million baht | % | million baht | % | ||
| Assets | 515.97 |
100.00% |
511.45 |
100.00% |
0.88% |
| Liabilities | 202.54 |
39.25% |
202.75 |
39.64% |
-0.11% |
| Shareholders' equity | 313.43 |
60.75% |
308.70 |
60.36% |
1.53% |
Assets
As of June 30, 2014, the Company's total assets were 515.97 million baht, which increase by 4.51 million baht (0.88% YoY) from the previous year, mainly due to the increase in trade and other receivables 20 million baht and the increase in inventories 10.06 million baht, while cash and cash equivalent were decrease by 22.49 million baht.
Liabilities
The Company's total liabilities as of June 30, 2014 were 202.54 million baht which decrease by 0.11% from the previous year, mainly due to the decrease in bank overdraft and loan from financial institutions 7.92 million baht while trade and other payable were increase 6.41 million baht.
Shareholders' equity
As of June 30, 2014, Shareholders' equity was 313.43 million baht, increase by 4.73 million baht (1.53% YoY) from the previous year, due to the resulting from net profit of the period.
The company's registered capital had been increase 27 million shares of 1 baht each in order to pay for stock dividend to shareholders.
Management Discussion & Analysis (MD&A) Quarter 1/2014
Operating performance
unit : million baht
| 1Q2014 | 1Q2013 | % Change | 4Q2013 | % Change | |
|---|---|---|---|---|---|
| Revenue from sales | 198.52 |
192.60 |
3.07% |
194.93 |
1.84% |
| Revenue from rendering of services | 1.22 |
1.02 |
19.73% |
1.27 |
-4.35% |
| Other Revenue | 2.06 |
3.55 |
-41.96% |
0.39 |
424.92% |
| Total Revenue | 201.79 |
197.16 |
2.35% |
196.60 |
2.64% |
| Cost of sales | 143.19 |
137.80 |
3.91% |
135.28 |
5.85% |
| Cost of rendering of services | 1.04 |
0.95 |
9.94% |
1.47 |
-29.55% |
| Total Costs | 144.23 |
138.74 |
3.95% |
136.75 |
5.47% |
| Gross Profit | 55.50 |
54.87 |
1.15% |
59.45 |
-6.64% |
| Gross Profit (%) | 27.79% |
28.34% |
-0.55% |
30.30% |
-2.51% |
| Total Selling & Administrative Expenses | 42.78 |
37.72 |
13.40% |
47.74 |
-10.40% |
| EBIT | 14.78 |
20.69 |
-28.56% |
12.10 |
22.16% |
| EBIT (%) | 7.32% |
10.49% |
-3.17% |
6.15% |
1.17% |
| Net Profit | 11.52 |
15.74 |
-26.80% |
7.80 |
47.76% |
| Net Profit (%) | 5.71% |
7.99% |
-2.27% |
3.97% |
43.96% |
| EPS | 0.09 |
0.12 |
-26.80% |
0.06 |
47.76% |
Revenue
unit : million baht
| Revenue structure | 1Q2014 | % | 1Q2013 | % | % Change |
|---|---|---|---|---|---|
| Occupational safety, health and environment products | 163.44 |
82% |
153.82 |
79% |
6.26% |
| Control environment products | 29.43 |
15% |
30.66 |
16% |
-4.04% |
| Water treatment products | 6.86 |
3% |
9.13 |
5% |
-24.85% |
| Total revenue from sales and services | 199.73 |
100% |
193.61 |
100% |
3.16% |
In quarter 1/2014, the Company's consolidated revenue from sales and services were 199.73 million baht, increase by 6.12 million baht (3.16% YoY), compared with 193.61 million baht in the same quarter of previous year.
The Company's sales were 198.52 million baht, increased by 5.92 million baht (3.07% YoY) compared with 192.60 million baht in the same quarter of previous year, due to the increase sales of occupational safety, health and environment products. There are orders increase from government sector customers and petrochemical sector customers. However, the order from major industrial customers had slowdown according to the country economy slowdown.
Cost of Sales and Services
In quarter 1/2014, the Company's cost of sales and services amounted to 144.23 million baht comprising of 143.19 million baht of cost of sales and 1.04 million baht of cost of services. The cost of sales and services increase by 5.49 million baht (3.95%YoY) compared with the same quarter of previous year.
In quarter 1/2014, Cost of sales and services was accounted for 72.21% of total sales and services revenue resulting in 27.79% of gross profit margin, which decrease from 28.34% in the same quarter of previous year. The decrease of gross profit margin was due to an increase of sales of low gross profit margin products.
Selling and Administrative Expenses
In quarter 1/2014, selling and administrative expenses amounted to 42.78 million baht comprised of selling expenses amounted to 20.90 million baht and administrative expenses amounted to 21.88 million baht. The increase of selling and administrative expenses was mainly due to increase in staff benefits and expenses from new subsidiaries.
Net profit
The Company's net profit after minority interest was 11.52 million baht accounted for net profit margin 5.71%, decrease by 4.22 million baht (26.80% YoY) compared with 15.74 million baht accounted for net profit margin 7.99% in the same quarter of previous year.
Financial Position
| Consolidated | March 31, 2014 | December 31, 2013 | % Change | ||
|---|---|---|---|---|---|
| million baht | % | million baht | % | ||
| Assets | 506.06 |
100.00% |
511.45 |
100.00% |
-1.05% |
| Liabilities | 185.37 |
36.63% |
202.75 |
39.64% |
-8.58% |
| Shareholders' equity | 320.69 |
63.37% |
308.70 |
60.36% |
3.89% |
Assets
As of March 31, 2014, the Company's total assets were 506.06 million baht, which decrease by 5.39 million baht (1.05% YoY) from the previous year, mainly due to decrease in inventories 4.9 million baht and cash and cash equivalent 21.28 million baht while trade and other receivable were increase by 21.16 million baht.
Liabilities
The Company's total liabilities as of March 31, 2014 were 185.37 million baht which decrease by 17.38 million baht from the previous year, mainly due to decrease in bank overdraft and short term loan from financial institutions 7.96 million baht and trade and other payable 11.04 million baht.
Shareholders' equity
As of March 31, 2014, Shareholders' equity was 320.69 million baht, increase by 11.99 million baht (3.89% YoY) from the previous year, due to the resulting from net profit of the period.
Management Discussion & Analysis (MD&A) Yearly 2013
Operating performance
In 2013, the Company's consolidated revenue from sales and services were 773.88 million baht, decreased by 16.15 million baht (2.04% YoY) due to the fact that a decrease of revenue of sales in government sector. However company's net profit after minority interest amounted to 50.75 million baht, increase by 5.31 million baht (11.70% YoY) driven by an increase in sales of high margin products. Furthermore, there is a reduction in services cost in the subsidiary company, compared with the previous year.
Revenue
The Company's sales were 769.09 million baht, decreased by 17.14 million baht (2.17% YoY) compared with 786.23 million baht in 2012. The decrease in sales was due to decrease sales of control environment products in government sector, electronics sector and foods sector. However, the sales of occupational safety, health and environment products to petrochemical sector and automotive sector were increased according to industrial expansion.
Revenues from services were 4.79 million baht, increased by 0.99 million baht (26.01%YoY) driven by increased in efficiency of water treatment services project.
| Revenue Structure | 2013 | 2012 | % Change | ||
|---|---|---|---|---|---|
| Million Baht | % | Million Baht | % | ||
| Occupational Safety, Health and Environment Products | 617.29 |
79.77% |
597.17 |
75.59% |
3.37% |
| Control Environment Products | 123.46 |
15.95% |
152.94 |
19.36% |
-19.28% |
| Water Treatment Products | 33.12 |
4.28% |
39.91 |
5.05% |
-17.01% |
| Total Revenue from sales and services | 773.88 |
100% |
790.03 |
100% |
-2.04% |
Note * reclassified of products.
Other revenues were 2.79 million baht, comprised of 0.66 million baht from reversal allowance for loss on impairment of assets and 2.13 million baht from other income.
Cost of Sales and Services
In 2013, the Company's cost of sales and services amounted to 540.08 million baht comprising of 536.36 million baht of cost of sales and 3.71 million baht of cost of services. The cost of sales and services decreased by 31.23 million baht (5.47%YoY). The decrease in cost of sales was associated with lower sales revenues, the cost of services was decreased due to decrease of services cost of subsidiary company.
Cost of sales and services in 2013 was accounted for 69.79% of total sales and services revenue resulting in 30.21% of gross profit margin while the cost of sales and services in 2012 was accounted for 72.31% of total sales and services revenue resulting in 27.69% of gross profit margin. The increase of gross profit margin was due to an increase of high gross profit margin products, compared with 2012. Furthermore, the gross profit margin of services business was improved from higher efficiency and no loss in subsidiary company's project as increase in 2012.
Selling and Administrative Expenses
In 2013, Selling and administrative expenses amounted to 168.91 million baht comprised of selling expenses amounted to 79.98 million baht, administrative expenses amounted to 85.58 million baht, bad debt and doubtful account amounted to 1.25 million baht and loss from exchange rate amounted to 2.10 million baht. The increase of selling and administrative expenses was mainly due to increase in expenses from 2 newly established subsidiaries and the loss from exchange rate which was gain in the previous year.
The Company's net profit after minority interest was 50.75 million baht accounted for net profit margin 6.53%, increased by 5.31 million baht from last year (11.70% YoY).
Profitability Ratio
| Consolidated | 2013 | 2012* |
|---|---|---|
| Gross Profit Margin | 30.21% |
27.69% |
| Operating Profit Margin | 10.25% |
9.72% |
| Net Profit Margin | 6.53% |
5.72% |
| Return on Equity | 16.77% |
15.87% |
Note *Restated
In 2013, the company's return on equity was 16.77%, increase from 15.87% in 2012, due to the fact that the increase portion of high gross profit margin products, while percentage of increase in selling and administrative expenses were lower than percentage of gross profit margin. As the result, the company's operating profit margin and net profit margin were increase.
Financial Position
| Consolidated | 2013 | 2012* | % Change | ||
|---|---|---|---|---|---|
| Million Baht | % | Million Baht | % | ||
| Assets | 511.45 |
100.00% |
507.96 |
100.00% |
0.69% |
| Liabilities | 202.75 |
39.64% |
215.99 |
42.52% |
-6.13% |
| Shareholder’s equity | 308.70 |
60.36% |
291.97 |
57.48% |
5.73% |
Note *Restated
Assets
The Company's total assets as of December 31, 2013 were 511.45 million baht comprised of current assets amounted to 358.62 million baht and non-current assets amounted to 152.83 million baht. Total assets increased by 6.82 million baht (1.34% YoY) from total assets of 507.96 million baht in 2012. The increasing was mainly due to increase in cash and cash equivalent.
Trade receivables
In 2013, the company's trade receivables were amounted to 108.65 million baht which decrease from 2012, due to the decrease in sale volume. Furthermore, the company's credit term policy is at least 30 days, then, the average credit term was 51.91 days which was closely to 2012 at 52.85 days. The company will consider payment term from past performance, sales order and historical payment. Furthermore, the company will recognize allowance for doubtful account by estimated losses that may incurred in collection of receivables which was generally based on collection history, current financial status of account receivables. Accordingly, the company will analyze each account receivables which aging over 180 days past due and inactive movement. Thus, the company set up allowance for doubtful account at rate 100% of total remaining receivables. In 2013, the company decrease allowance for doubtful account by 0.11 million baht, decrease from 0.17 million baht in 2012.
Inventories-net
In 2013, the company's inventories-net were 189.30 million baht, decrease by 6.32 million baht from 2012 or 3.23% (YoY). According to the policy for set up allowance for diminution in value of inventories for obsolete or impaired goods, the company will consider from aging and condition of goods, quick obsolete goods aging over 1 year will be set up allowance for diminution in value of inventories of 50% of inventories value, quick obsolete goods aging over 2 year or impaired goods will be set up allowance for diminution in value of inventories of 100%. In 2013, the Company recorded an allowance for diminution in value of inventories amounted to 3.95 billion baht.
Property, plant and equipment - net
In 2013, Property, plant and equipment - net was 147.85 million baht, decrease by 4.95 million baht from 2012, mainly due to the deduction of depreciation amounted to 11.94 million baht. However, the assets were increase mainly to furniture, office equipment, building improvement and utilities for branch office and information systems improvement of the company, amounted to 5.68 million baht.
Liabilities
The Company's total liabilities as of December 31, 2013 were 206.05 million baht comprised of current liabilities amounted to 178.73 million baht and non-current liabilities amounted to 27.32 million baht. Total liabilities decreased by 9.94 million baht (4.60%YoY) from total liabilities of 215.99 million baht in 2012. The decreased was mainly due to decrease in long-term loan from financial institutions.
The Company had contingent liabilities with financial institution as follows;
Unit : Million Baht
| Item | Credit Line | Draw down | Remaining |
|---|---|---|---|
| Letters of credits and trust receipt | 188.00 |
36.01 |
151.99 |
| Promissory Notes | 65.00 |
10.00 |
55.00 |
| Letters of guarantee | 30.70 |
2.11 |
28.59 |
| Bank overdraft | 56.50 |
6.64 |
49.86 |
| Forward exchange contracts: Baht | 220.00 |
15.33 |
204.67 |
| Forward exchange contracts : USDOLLAR | 1.15 |
0.58 |
0.57 |
Shareholders' equity
Shareholders' equity as of December 31, 2013 was 310.52 million baht, increase by 15.73 million baht (5.33% YoY) from 2012, which had shareholders' equity of 294.79 million baht. The increase was the resulting from net profit for the year 2013.
In 2013, the Company had debt-to-equity ratio of 0.65 times, decreased from 0.75 times in 2012 due to the shareholders' equity was increase by 16.73 million baht from retained earnings while liabilities were decreased by 13.24 million baht.
Cash Flow
Unit : Million Baht
| Cash Flow | Dec 31, 2013 | Dec 31, 2012* |
|---|---|---|
| Cashflow from (used in) operating activities | 60.45 |
56.55 |
| Cashflow from (used in) investing activities | (4.60) |
(5.43) |
| Cashflow from (used in) financing activities | (30.23) |
(46.22) |
| Net increase (decrease) in cash and cash equivalents | 25.62 |
4.91 |
| Cash and cash equivalents at the end of the year | 49.61 |
23.90 |
Note *Restated
The Company had net cashflow from operating activities amounted to 60.45 million baht in which the profit from operations before change in operating assets and liabilities amounted to 84.37 million baht. Assets and liabilities from operation were changed mainly due to decrease in trade and other receivables amounted to 2.22 million baht, decrease in inventories amounted to 4.89 million baht, decrease in trade and other payable amounted to 9.63 million baht, increase in employee benefits paid amounted to 8.10 million baht and tax payment amounted to 14.25 million baht.
Cashflow used in investment activities amounted to 4.6 million baht which was cash for acquisition of fixed assets and computer software.
Cashflow used in financing activities amounted to 30.23 million baht due to repayment of long-term loan and repayment of liabilities under long-term lease agreement amounted to 23.15 million baht, interest payment amounted to 3.25 million baht and dividend payment amounted to 35.08 million baht. However, the Company had cash received from bank overdraft and short-term loan from financial institution amounted to 29.19 million baht.
The Company's cash and cash equivalents as of December 31, 2013 was 49.26 million baht increase by 25.72 million baht compared with December 31, 2012.
Liquidity ratio
| 2013 | 2012* | |
|---|---|---|
| Current Ratio (times) | 2.04 |
1.98 |
| Average collection period (days) | 51.91 |
52.85 |
| Average payment period (days) | 59.96 |
57.42 |
| Average inventories on hand (days) | 130.07 |
119.94 |
| Cash Conversion Cycle (days) | 122.02 |
115.37 |
Note *Restated
In 2013, the Company's current ratios were 2.04 times, increased by 0.06 times from 2012, due to an increase in current assets of cash and cash equivalents while the current liabilities were at the same level as in 2012
The Company's average collection period was 51.91 days which was closely to 2012 at 52.85 days. The Company's average inventories on hand was 130.07 days, increased by 10.13 days from 2012 due to the company increased purchasing volume of products. And the Company's average payment period was at 59.96 days increased by 2.54 days from 2012, most of purchasing orders were imported goods which allowed longer credit term compared with domestic order.
Management Discussion & Analysis (MD&A) Yearly 2012
Overview of operating performance for the year 2012
In 2012, the Company's consolidated net profit after minority interest totaled 44.73 million baht, increased by 15.87 million baht (54.99% YoY) driven by an increase of revenue from sales of safety, occupational health and environmental products and services. The increase was in line with an expansion of industrial sectors. Due to the Thai Baht appreciation, the Company which has mainly imported goods from foreign countries, record gain on foreign exchange compared with loss in the previous year.
Selling and administration expenses was decreased due mainly to the decline of the subsidiary's selling and administration expenses, lower of bad debt and doubtful debt compared with the previous year as well as the decline of finance cost following the decrease of bank overdrafts and borrowings interest rate. Furthermore, the reduction of tax rate resulted in lower corporate tax expense.
Operating performance
- Revenue
In 2012, the Company's sales and services revenues were 790.03 million baht, increased by 70.89 million baht (9.86% YoY) compared with 719.14 million baht in 2011.
The core revenue was mainly contributed by occupational safety, health and environment products in amount of 620.90 million baht or accounted for 78.59% of total revenue. It increased by 54.82 million baht (9.68% YoY) following an expansion of industrial sectors especially automotive sector, petrochemical sector, and construction sector which are key customers. The key products for these customer groups are personal protective equipments category. Moreover, the top sales products were safety gloves, safety footwear, and safety goggles.
In 2012, revenue from control environment products totaled 129.21 million baht accounted for 16.36% of total sales and services revenue, increased by 16.73 million baht (14.87% YoY) driven by an increase in sales order volume from electronic sectors which recovered from the great flood in late of 2011.
In 2012, revenue from water treatment products totaled 39.91 million baht, decreased by 0.68 million baht from 2011 or 1.68% (YoY). In 2012, revenue from sales of water treatment equipments increased by 19.56 million baht while the revenue from design, manufacturing, and installment of water treatment systems decreased by 20.24 million baht.
Consolidated Financial Statement 2012 2011 Change
%Million baht % Million baht % Occupational Safety, Health and Environment Products 620.9078.59%566.0878.71%9.68%Control Environment Products 129.2116.36%112.4815.65%14.87%Water Treatment Products 39.915.05%40.595.64%(1.68%)Total revenue from sales and services 790.03100%719.14100%9.86%The Company's other revenues were totaled 4.10 million baht, comprising of 1.47 million baht from gain on foreign exchange following Thai Baht appreciation and 2.62 million baht from other income. In 2012, the Company's total revenue was 794.13 million baht, increased by 72.19 million baht from 721.94 million baht in 2011 or 9.99% (YoY)
- Costs of sales and services
In 2012, the Company's cost of sales and services totaled 571.31 million baht comprising of 564.11 million baht of cost of sales and 7.20 million baht of cost of services. The cost of sales and services increased by 62.54 million baht (12.29% YoY). The increase in cost of sales was associated with higher sales revenue as well as the rising in sales volume of low gross profit margin products. Meanwhile, the cost of services was decreased due to the revenue from design, manufacturing and installment of water treatment compared with 2011.
Cost of sales and services in 2012 was accounted for 72.31% of total sales and services revenue resulting in 27.69% of gross profit margin while the cost of sales and services in 2011 was accounted for 70.75% of total sales and services revenue resulting in 29.25% of gross profit margin. The decline of gross profit margin was due to an increase sales of safety, occupational health and environmental products and services, which earned low gross profit margin, compared with 2011. Furthermore, the gross profit margin of water treatment products and services was not at high level. Meanwhile, the gross profit margin of services business was negative due to the loss in subsidiary company's project following the delay of service delivery.
- Selling and administration expenses
Selling expenses comprised of personnel expenses, related marketing promotion expenses, transportation expenses and other selling expenses. In 2012, the Company's selling expenses totaled 78.65 million baht increased by 2.61 million baht (3.43% YoY) due mainly to the higher of personnel expenses following the increase of staffs, variable pay for performance and higher transportation expenses which was varied with higher sales volume.
Administration expenses comprised of personnel expenses, depreciation expenses and related administration expenses. In 2012, the Company's administration expenses totaled 82.22 million baht, decreased by 9.36 million baht (10.22% YoY) due mainly to the decrease of selling and administration expenses of subsidiary company by 6.5 million baht and lower of bad debt and doubtful debt by 3.85 million baht.
The finance cost in 2012 totaled 3.49 million baht, decreased by 0.89 million baht from 2011 due to the decrease of bank overdrafts and borrowings interest rate.
Corporate tax totaled 14.54 million baht, decreased by 1.45 million baht due to lower of tax rate.
- Operating Profit
In 2012, the Company's operating profit totaled 61.94 million baht, accounted for operating profit margin of 7.80%. The operating profit increased from 2011 following the higher revenue and lower operating expenses.
- Net Profit
The Company's net profit was 44.73 million baht, increased by 15.87 million baht or 54.99% (YoY) accounted for net profit margin of 5.63%
Profitability Ratio
Consolidated Financial Statement 2012 2011 Gross Profit Margin 27.69%29.25%Operating Profit Margin 7.80%6.30%Net Profit Margin 5.63%3.49%Return on Equity 15.96%10.40%In 2012, the Company's return on equity was 15.96% increased from 10.40% in 2011 driven by an increase in sales. Although the gross profit margin was decreased resulting from the negative gross profit margin of water treatment system business however, overall expenses was declined including selling and administration expenses, bad debt and doubtful debt, finance cost as well as lower tax rate. As the result, the Company's net operating profit and net profit margin were increased.
Financial Position
| Consolidated Financial Statement | 2012 | 2011 | Change % |
||
|---|---|---|---|---|---|
| Million baht | % | Million baht | % | ||
| Assets | 501.63 |
100.00% |
483.28 |
100.00% |
3.80% |
| Liabilities | 215.99 |
43.06% |
213.21 |
44.21% |
1.30% |
| Shareholders’ equity | 285.64 |
56.94% |
272.08 |
56.30% |
4.98% |
Asset
The Company's total assets as of December 31, 2012 were 501.63 million baht. The assets mix comprised of 348.18 million baht of current assets, 153.46 million baht of non-current assets. Total assets increased by 18.35 million baht or 3.8% (YoY) from total assets of 483.28 million baht in 2011 due mainly to an increase of inventories totaling 15.75 million baht.
- Trade and other receivables-net
In 2012, the Company's trade receivables were totaled 124.21 million baht which increased from 2011 due to trade receivables was varied a long with higher sales volume. Furthermore, the Company's credit term policy is at least 30 days. Thus, the average credit term for the customer was 53 days in which the Company will consider payment term from past performance, sales order, and historical payment. Furthermore, the Company will recognize allowance for doubtful account by estimated losses that may incurred in collection of receivable which was generally based on collection history, current financial status of account receivables. Accordingly, the Company will analyze each account receivables which aging over 180 days past due and inactive movement. Thus, the Company set up allowance for doubtful account at rate 100% of total remaining receivables. In 2012, the Company increased allowance for doubtful account by 0.17 million baht. The Company's other receivables are comprised of advance payment, withholding tax, undue input value added tax, etc.
- Inventories-net
In 2012, the Company's inventories-net were 195.62 million baht, increased by 15.76 million baht from 2011 or 8.76% (YoY). The inventories were increased due mainly to an rising of new product in order to expand the market.
According to the policy for set up allowance for diminution in value of inventories for obsolete or impaired goods, the Company will consider from aging and condition of goods as follows;
- Quick obsolete goods aging over 1 year (ex. shoes, eye-glasses, and rubber gloves, etc.) will be set up allowance for diminution in value of inventories of 50% of inventories value.
- Quick obsolete goods aging over 2 years will be set up allowance for diminution in value of inventories of 100% of inventories value.
- Impaired goods will be set up allowance for diminution in value of inventories of 100%.
In 2012, the Company's allowance for diminution in value of inventories increased by 1.88 million baht from 2011. Meanwhile, allowance for diminution in value of inventories in 2011 increased by 3.12 million baht from 2010. The amount of allowance for diminution in value of inventories was decreased due to an improvement of inventory management.
- Property, plant and equipment - net
Property, plant and equipment-net in 2012 was 152.80 million baht, decreased by 6.86 million baht from 2011 due to the deduction of depreciation amounted to 15.07 million baht. During the year, there were acquisition of new assets in term of demonstration goods totaling 2.12 million baht, furniture and equipment totaling 2.24 million baht and other assets totaling 0.63 million baht.
Source of Funds
Liabilities
As of December 31, 2012, the Company's liabilities were 215.99 million baht increased by 2.78 million baht from December 31, 2011 or 1.30% (YoY). The liabilities mix comprised of 175.57 million baht, decreased by 6.68 million baht from 2011 following the decline of bank overdraft and short-term borrowing by 17.28 million baht and liabilities which due in 1 year decreased by 2.57 million baht however, the trade payables increased by 12.37 million baht.
The Company's non-current liabilities were 40.42 million baht, increased by 9.47 million baht due mainly to the Company entered into the long-term loan agreement facilities of 30 million baht. In addition, the Company recognized an increase in employment benefit by 3.59 million baht.
The Company had contingent liabilities with financial institution as follows;
| Item | Unit : Million Baht | ||
|---|---|---|---|
| Credit Line | Draw down | Remaining | |
| L/C and T/R | 188.00 |
21.46 |
166.54 |
| Promissory Notes | 65.00 |
- |
65.00 |
| Trust Receipt | 30.70 |
5.32 |
25.38 |
| Bank overdraft | 46.50 |
2.71 |
43.79 |
| Foreign currency forward contract : Thai Baht | 220.00 |
- |
220 |
| Foreign currency forward contract : US Dollars | 1.15 |
- |
1.15 |
Shareholders' equity
Shareholder's equity as of December 31, 2012 was 288.46 million baht, increase by 16.38 million baht (5.77% YoY) from 2011, which had shareholders equity of 272.08 million baht, resulting from net profit for the year 2012 totaled 42.27 million baht.
In 2012, the Company had debt-to-equity ratio of 0.75 times, decreased from 0.78 times in 2011 due to an increase of shareholders' equity while liabilities were at the same level as in 2011.
| Cashflow | 2012 Million Baht |
2011 Million Baht |
|---|---|---|
| Cashflow from (used in) operating activities | 56.55 |
(1.10) |
| Cashflow from (used in) investing activities | (5.43) |
(8.30) |
| Cashflow from (used in) financing activities | (46.22) |
(50.58) |
| Net increase (decrease) in cash and cash equivalents | 4.91 |
(59.99) |
| Cash and cash equivalents at the end of the year | 23.90 |
19.00 |
Liquidity
In 2012, the Company had net cashflow from operating activities totaled 56.55 million baht in which the profit from operating activities before change in operating assets and liabilities totaled 79.26 million baht. Assets and liabilities from operation were changed due mainly to an increase of 4.93 million baht in trade receivable which varied along with higher sales. The inventories increased by 17.39 million baht from purchasing of new product in which the Company was expanding the market. Meanwhile, trade payable increased by 13.19 million baht and tax payment of 13.92 million baht.
Cashflow used in investment activities totaled 5.43 million baht which was cash paid for acquisition of fixed assets amounted to 4.99 million baht from acquisition of demonstration goods, decoration and office furniture and computer software, cash paid in loan to employee increased by 0.79 million baht. And cash from interest received of 0.36 million baht.
Cashflow used in financing activities totaled 46.22 million baht due to the decline of bank overdraft and short-term borrowing by 17.25 million baht, paid to leasehold right and repayment of long-term loan totaled 27.64 million baht, interim dividend payment of 28.35 million baht, interest payment of 2.99 million baht. However, the Company had cash received from long-term loan with financial institution amounted to 30 million baht.
The Company's cash and cash equivalents as of December 31, 2012 was 23.90 million baht increased by 4.91 million baht compared with as of December 31, 2011.
Liquidity Ratio
The Company's liquidity ratios were 1.98 times, increased by 0.21 times from 2011 following the Company had higher current assets from 2011 by 7.69% while the current liabilities decreased by 3.67% resulting in higher liquidity ratio.
The Company's average collection period in 2012 was 52.85 days which was closely to 2011 at 53.74 days. In addition, the Company has prudent credit policy and regularly reviewed.
In 2012, the Company's average inventories on hand was 119.94 days, increased by 9.02 days from 2011 due to the Company increased purchasing volume of new product.
In 2012, the Company's average payment period was at 57.42 days increased by 5.54 days from 2011 following higher volume of purchasing order whereby most of purchasing orders were imported goods which allowed longer credit term compared with domestic order.
| Liquidity ratio | 2012 | 2011 |
|---|---|---|
| Liquidity ratio (times) | 1.98 |
1.77 |
| Current ratio (times) | 0.87 |
0.79 |
| Average collection period (days) | 52.85 |
53.74 |
| Average payment period (days) | 57.42 |
51.88 |
| Average inventories on hand (days) | 119.94 |
110.92 |
| Cash Conversion Cycle (days) | 115.37 |
112.78 |
Management Discussion & Analysis (MD&A) Yearly 2011
Operating Performance Overview
In 2011, the Company's core business is a distributor of occupational health and safety products, exhibited good expansion in line with the domestic economy. Although the Company was affected by flooding crisis in the fourth quarter, the revenue from sales of occupational health and safety products still expanded by 10.27% (YoY).
With regard to the water treatment business, the revenue improved from 2010 driven by the continually carried out of marketing activities. In the second quarter of 2011, the Company additionally invested in its subsidiaries amounted to Baht 8.50 million, representing 76.67% of the share capital of its subsidiaries. However, the Subsidiary's revenue has been below the target, resulting in net operating loss in 2011.
In 2009, 2010, and 2011, the Company's total revenues were Baht 475.80 million, Baht 648.83 million, and Baht 721.94 million, respectively. The net profit in 2009, 2010, and 2011 in amount of Baht 17.61 million, Baht 37.76 million, and Baht 25.18 million, respectively. In 2009, the Company recorded a profit from the sale of investment in Angle Alliance Co., Ltd. amounted to Baht 4.52 million.
In 2009, 2010, and 2011, the Company's total assets were Baht 357.92 million, Baht 483.86 million, and Baht 483.28 million, respectively. In 2010, an increase in total assets was driven by rising in account receivables and inventories following the expansion in sales and remaining cash from capital rising in stock market in December 2010.
Operating Performance Analysis
Income
In 2010, the Company's sales and services revenues were Baht 637.87 million, up by 36.14% (YoY) resulting from higher sales order following the economic recovery from the contraction which deteriorating sales revenue in 2009.
In 2011, the Company's sales and services revenues were Baht 719.14 million, increased by 12.74% (YoY) following an increase of sales order contributed by improvement in economic condition. Moreover, an increase in core revenue was driven by higher sales of personal protective equipments, safety and environmental equipments.
For the revenue structure in 2009, 2010, and 2011, the revenue from sales of personal protective equipment accounted for 83.02%, 81.04% and 80.79% of total revenues, respectively. The revenue from occupational safety equipments accounted for 15.45%, 14.08% and 13.20% of total revenues, respectively. The revenue from water treatment system accounted for -%, 3.49% and 5.62% of total revenues, respectively while other revenues accounted for 1.53% and 1.39% and 0.39% of total revenues, respectively.
With regard to the sales of water treatment equipments and design, manufacture, construction and installment of water treatment systems business, the Company has operated this business since 2009. In 2010 and 2011, the Company's revenue from sales of water treatment equipments amounted to Baht 4.21 million, and Baht 16.55 million while revenue from design, manufacture, construction and installment of water treatment systems amounted to Baht 18.02 million, and Baht 21.93 million, respectively.
Costs and Expenses
- Costs of sales and services
The Company's costs of sales and services of the year 2009, 2010, and 2011 were Baht 329.34 million, Baht 438.68 million, and Baht 508.77 million, respectively which accounted for 70.29%, 68.77% and 70.75% of total revenues, respectively. As the result, the Company's gross profit margin in 2009, 2010, and 2011 by 29.71%, 31.23% and 29.25% of total revenues, respectively. In 2010, gross profit margin improved due to lower price competition amid ongoing economic recovery. In 2011, gross profit margin declined due to higher share of low gross margin products, coupled with negative gross profit margin in service business. - Selling and Administrative Expenses
Selling and Administrative Expenses comprised of personnel expenses, depreciation, interest, advertising, product exhibition and transportation expenses, etc. In 2009, 2010, and 2011 selling and administrative expenses were Baht 113.11 million, Baht 147.47 million, and Baht 167.61 million, respectively accounted for 24.36%, 23.16% and 23.31% of total revenues, respectively.
The selling expenses in 2009, 2010, and 2011 were Baht 39.83 million, Baht 68.71 million, and Baht 76.04 million, respectively accounted for 8.50%, 10.77% and 10.57% of total revenue, respectively. In 2009, the proportion of selling expenses were increased due to declining in sales together with there was fixed selling expenses that did not vary with the declining in sales. In 2010 and 2011, the proportion of selling expenses increased from 2009 following an increase amount of employees in associated with business expansion, rising sale incentive for sales officer to motivate higher business volume, and new bonus scheme for sales function started from 2010.
For the administrative expenses in 2009, 2010 and 2011 were Baht 74.29 million, Baht 79.04 million, and Baht 86.97 million, respectively accounted for 15.86%, 12.39% and 12.09% of total revenues, respectively.
The administrative expenses consisted of a proportion of fixed expenses such as personnel expenses, etc. In 2009, the proportion of administrative expenses increased due to lower of 18.57% in sales. Meanwhile, the sales and services revenue in 2010 improved by 36.14% (YoY) resulting in lower in proportion of administration expenses from the previous year. - Operating Profit Margin
Operating profit margin excluding of non-recurring items in 2009, 2010 and 2011 accounted for 6.65%, 8.98% and 6.30%, respectively.
In 2009, the operating profit margin declined due to lower in gross profit margin following price competition during the economic crisis together with the lower in sales, resulting in higher selling and administration expenses in which there were some fixed expenses that did not vary with declining in sales.
In 2010, the operating profit margin increased following an increase in gross profit margin due to lower price competition.
In 2011, the operating profit margin decreased due mainly to decrease in gross profit margin and impairment loss of obsolete inventories, impairment loss of fixed assets, and impairment loss of doubtful account. - Net Profit Margin
Net profit margin for the year 2009, 2010, and 2011 was 3.70%, 5.84% and 3.49%, respectively. Items affected net profit margin for the year 2009, 2010, and 2011 are summarized as follows;
In 2009, the Company's net profit margin was significantly declined due to decrease in sales and lower in gross profit margin following economic downturn which affected product demand coupled with higher price competition. In 2010, the Company's net profit margin increased following recovery of economy and industry of the Company's customer base together with lower price competition.
In 2009, 2010, and 2011, the Company's return on equity was 10.93%, 17.71% and 10.40%, respectively. In 2009, the return on equity was declined due to declining in profitability following lower in sales and gross profit margin. In contrast, sales and gross profit improved in 2010 resulting in higher return on equity. In addition, net profit, net profit margin, and return on equity of separate financial statement were higher than those in consolidated financial statement for the year 2010 due to loss in its subsidiaries. Moreover, the Subsidiary started business operation in November 2009 and continually carried out marketing activity since commencement however, it required a certain period of time to penetrate the market. As the result, the Subsidiary initially recorded revenue in the third quarter of 2010. The subsidiary therefore recorded net loss in 2010. In 2011, the return on equity decreased from 2010 due to water treatment system business recorded negative gross profit margin. Furthermore, the Company recorded allowance for doubtful account of its subsidiaries and impairment loss of fixed assets.
Profitability Ratio Consolidated Financial Statement Separate Financial Statement 2009 2010 2011 2009 2010 2011 Gross Profit Margin 29.71% 30.87% 29.25% 29.71% 31.01% 30.63% Operating Profit Margin 6.65% 8.98% 6.30% 5.39% 8.49% 6.63% Net Profit Margin 3.70% 5.84% 3.49% 2.97% 6.69% 4.21% Return on Equity 10.93% 13.93% 10.40% 8.55% 18.99% 10.48%
Financial Position
Assets
The Company's total assets in 2009, 2010, and 2011 were Baht 357.91 million, Baht 483.86 million, and Baht 483.28 million, respectively. The key assets including account receivable, inventory, and property, plant and equipment.
In 2009, the Company's total assets decreased due to lower of inventories and account receivables resulting from the Company released the inventories and decelerate the replenishment. Meanwhile, account receivable was decreased due to a lower in sales. In addition, the Company sold of investment in Angel Alliance Co., Ltd. together with loan and accrued interest of that Company.
In 2010, the Company's total assets increased from the end of 2009 due to an increase in account receivable and inventories following an increase in sales compared with the same period of previous year.
In 2011, the Company's total assets almost unchanged from the total assets at the end of 2010
- Trade receivables
In 2009, 2010, and 2011, the Company's trade receivables were Baht 81.39 million, Baht 100.76 million, and Baht 110.98 million, respectively. In 2009, the trade receivable increased while sales dropped due to the Company expanded payment period for customer who was affected by economic slowdown. Upon the improvement in economy in 2010, the sales improved from the previous year resulting in higher account receivables. For the year 2011, trade receivables increased following improvement in sales.
The Company's credit term is at least 30 days. The average credit term for the customer is in range of 50 - 60 days. The Company will consider payment term from past performance, sales order, and historical payment.
In addition, the outstanding balance of trade account receivable aged by number of days as of December 31, 2009, 2010, and 2011 are detailed as follows;
Unit : BahtAging Consolidated Financial Statement December 31, 2009 December 31, 2010 December 31, 2011 Not yet due 58,210,542.81 60,980,779.64 66,253,064.10 Over-due: 1-60 days 22,442,277.59 34,987,328.57 41,573,097.19 61-120 days 662,214.30 3,509,839.60 3,182,491.04 121-180 days 57,587.40 1,496,744.36 290,181.79 Over 180 days 2,512,401.43 2,193,538.30 5,940,717.48 Total 83,885,023.53 103,168,230.47 117,239,551.60 Less Allowance for doubtful accounts 2,499,138.29 2,409,326.44 6,254,409.10 Trade receivables - net 81,385,885.24 100,758,904.03 110,985,142.50 The Company will recognize allowance for doubtful account by estimated losses that may incurred in collection of receivable which generally based on collection history, current financial status of account receivables. Normally, the Company will analyze each account receivables which aging over 180 days past due and inactive movement. Thus, the Company set up allowance for doubtful account at rate 100% of total remaining receivables.
The account receivables over 180 days past due in 2009, 2010, and 2011 were Baht 2.51 million, Baht 2.19 million, and Baht 5.94 million, respectively. The Company has allowance for doubtful account during 2009, 2009, and 2011 were Baht 2.50 million, Baht 2.41 million, and Baht 6.25 million, respectively. In 2009, the allowance for doubtful account increased resulting from the customer loss repayment ability as he was in financial trouble, in which sales of such account was recognized in late of 2008. Furthermore, the Company has fully set up provision for doubtful account for that customer since 2009. In 2011, the rising in account receivable over 180 days past due was contributed by customer of water treatment business. - Inventories
In 2009, the Company's inventories totaled Baht 96.45 million, and Baht 128.78 million in 2010, decreased by 33.52% (YoY) in order to support higher sales in 2010. This amount included work in process of its subsidiaries amounted to Baht 2.70 million. As of December 31, 2011, the inventories totaled Baht 179.86 million, decreased by 39.66% (YoY) in order to support higher sales in 2012 as well as imported product in order to penetrating new target customer.Unit : Baht
Consolidated Financial Statement December 31, 2009 December 31, 2010 December 31, 2011 Finished goods 95,909,929.22 120,856,193.81 167,024,109.45 Goods in transit 5,948,152.34 9,077,965.42 17,554,373.96 Consignment goods - - 480,940.35 Work in process - 2,109,282.40 490,343.58 Raw materials - 2,249,990.75 713,061.77 Total 101,858,081.56 134,293,432.38 186,262,829.11 Less Allowance for diminution in value of inventories 5,407,479.66 5,515,119.54 6,400,357.46 Inventories - net 5,407,479.66 5,515,119.54 6,400,357.46 For the guideline to set up allowance for diminution in value of inventories for obsolete or impaired goods, the Company will consider from aging and condition of goods as follows;
- Quick obsolete goods aging over 1 year (ex. shoes, eye-glasses, and rubber gloves, etc.) will be set up allowance for diminution in value of inventories of 50% of inventories value.
- Quick obsolete goods aging over 2 years will be set up allowance for diminution in value of inventories of 100%.
- Impaired goods will be set up allowance for diminution in value of inventories of 100%.
Since beginning of the third quarter of 2010, the Company has policy to set up allowance for diminution in value of inventories for slow obsolete goods by considering from the aging of goods which greater than 5 years. Also, the Company considered to set up allowance for diminution in value of inventories for each item which its turnover greater than 5 years as appropriate.In 2009, the Company's allowance for diminution in value of inventories was Baht 5.41 million due mainly to allowance for diminution in value of safety shoes aging over 1 year whereby the Company had ordered during the second quarter of 2008. Furthermore, the slow releasing of goods was due to the declining in sales amid economic slowdown. As the result, the Company set up allowance for diminution in value of inventories of 50%, resulting in impairment loss of inventories in 2009 amounted to Baht 4.77 million.
In 2010, the Company's allowance for diminution in value of inventories was Baht 5.52 million, and recorded impairment loss of inventory amounted to Baht 2.31 million following allowance for diminution in value of inventories for slow obsolete goods aging greater than 5 years which had set up since the third quarter of 2009 as aforementioned. Moreover, the auditor was further set up allowance for diminution in value of inventories by considering the turnover of each product category. As the result, there was additionally allowance for diminution in value of inventories amounted to Baht 1.21 million.
In 2011, the Company's allowance for diminution in value of inventories was Baht 6.40 million, and recorded impairment loss of inventory amounted to Baht 0.89 million due to the guideline of allowance for diminution in value of inventories by considering the turnover of each product category. In 2011, the Company has increased allowance for diminution in value of inventories was Baht 3.12 million when compared to 2010. - Property, Plant and Equipment
Net property, plant and equipment for the year 2009, 2010, and 2011 was Baht 140.55 million, Baht 153.22 million, and Baht 153.56 million, respectively. A decline of property, plant and equipment in 2009 due mainly to depreciation, mostly comprised of office building and new warehouse with area of 5-0-1 Rai at Lumlukka district, Pathumthani which its investment value totaled Baht 138.36 million.
In addition, property, plant and equipment as of December 31, 2010 increased from 2009 due mainly to new acquisition of land and building amounted to Baht 12.55 million which used as Rayong branch. - Non-operating assets
Non-operating assets in 2009 and 2010 were Baht 7.28 million and Baht 2.57 million.
In 2009, the auditor has been changed accounting classification for property, plant and equipment which were not used for ongoing operation of the business resulting in higher value of non-operating assets in that period. Moreover, Industrial Condominium-Narita Building, Nontaburi was additionally recorded as non-operating asset.
In 2011, the auditors has changed asset classification by restating assets which were not used for ongoing operation of the business to classify under investment property item, applying retrospective to accounting classification in 2010.
For the operating guideline for non-operating assets, the Company will sale of assets when there are appropriate price available. During regular period, the Company has policy to lease such assets to generate income.
For the non-operating assets impairment guideline, the Company has applied the same standard as operating asset. - Investment in its subsidiaries
In November of 2009, the Company invested in PD Genesis Engineering Co., Ltd., who operates design, manufacture, construction and installment of wastewater treatment system, water supply and drinks, wastewater treatment system for reuse, totaled Baht 3 million or representing 60% of share capital of its subsidiaries.
In second quarter of 2010, the Company was additionally invested in PD Genesis Engineering Co., Ltd., who operates design, manufacture, construction and installment of wastewater treatment system, water supply and drinks, wastewater treatment system for reuse, amounted to Baht 11.5 million or representing 76.67% of share capital of its subsidiaries. However, the Subsidiary recorded net loss exceeds capital. Therefore, the Company has fully set up the total amount of impairment loss on investment in subsidiary. - Loan to Subsidiary Company
The Company granted short-term loan to its subsidiaries by issuing promissory note, which repay at call, amounting to Baht 5 million with interest rate MLR plus 3% per annum. The Subsidiary used short-term loan as working capital.
- Investments in associate company
In 2008 and 2009, the Company recognized net loss from equity investment of Angel Alliance Co., Ltd. amounted to Baht 0.95 million and Baht 0.34 million, respectively resulting in decrease of investment value amounted to Baht 1.06 million and Baht 0.72 million, respectively.
In June 2009, the Company however, sole of investment in Angel Alliance Co., Ltd. at par value together with loan totaled to 544,645 million Singapore dollars to Mr. Chavalit Wangthamrong, Mr. Teeradej Jarutangtrong and Mr. Xiao Li Yue who are the management of Angel Safety Equipment (Shaghai) Corporation Limited at portion of 11.20%, 4.80% and 9.00% of share capital, respectively. In addition, the Company recorded gain from sole of investment amounted to Baht 4.52 million. - Long-term investment for related party
In 2004, the Company invested in N&P Holding Co., Ltd., who operates restaurant business, amounted to Baht 1 million, representing 2% of total registered capital. Consequently, such Company continually record net loss and ceased business operation. In 2007, the Company had fully set up total amount of impairment loss on investment.
- Long-term long for associate company
The Company granted loan to Angel Alliance Co., Ltd. amounted to 544,645 Singapore Dollar with the interest rate of 4.25% per annum, in compliance with the shareholder agreement. There was no change of principal amount in 2007 and 2008 however, the financial statement showed different amount due to effect of exchange rate.
Due to Angel Alliance Co., Ltd. recorded net loss over time and unable to repay interest burden to the Company. In 2008, the Company therefore set up allowance for doubtful account for the portion of accrued interest payment of Baht 1,271,781.68 and record additional amount during 2009 until the Company had sole of investment in Angel Alliance Co., Ltd. Consequently, Mr. Chavalit and Mr. Teeradej have responsed to repay loan of 544,645 Singapore Dollar, coupled with accrued interest totaling 62,704.87 Singapore Dollar. - Long-term loan for related party
In 2009, the Subsidiary granted long term loan to related company, which was Genesis Environment Service Co., Ltd., in form of loan agreement facility with credit line of Baht 4.80 million, interest rate at 15% per annum with monthly installment. The first installment was in January 2010 and completed within 66 months. As of December 31, 2009, the loan was draw down by Baht 3.80 million. The loan agreement was in accordance with the agreement in persuading shareholder of Genesis Environment Service Co., Ltd., to joining invest and manage in its subsidiaries. However, Genesis Environment Service Co., Ltd. repaid full principal amounts to its subsidiaries in July 2010.
Liquidity
Cash flow from operations
In 2009, the Company's cash flow from operation amounted to Baht 86.98 million, mainly from an increase in profit before tax amounted to Baht 25.78 million, a decrease in inventory amounted to Baht 45.72 million and an increase in trade account payable amounted to Baht 22.61 million.
In 2010, the Company's cash flow from operation was Baht 22.51 million, mainly from a profit before tax amounted to Baht 52.90 million, an increase in inventory amounted to Baht 32.97 million and an increase in other current liabilities amounted to Baht 12.39 million.
In 2011, the Company's cash flow from operation amounted to Baht 1.10 million, mainly from a profit before tax amounted to Baht 41.17 million, an increase in inventory amounted to Baht 53.96 million, an increase in trade account receivable and account payable amounted to Baht 17.75 million and Baht 21.28 million, respectively.
In addition, in 2010, the Company had changed the auditors who reclassified the account types in financial statement for the year ended December, 31, 2009, which might caused some items such as cash and cash equivalents, not the same as the old classification in the balance sheet.
Cash Flows from Investing Activity
In 2009, the Company's cash flow from investing amounted to Baht 15.62 million, mainly from cash received from sales of long-term debentures to its subsidiaries amounted to Baht 12.62 million, cash received from sale of investment in its subsidiaries amounted to Baht 4.35 million and cash paid for long-term debentures to its subsidiaries, Genesis Environment Service Co., Ltd. amounted 3.80 million baht. Meanwhile, cash flow received from investing activities in separated financial statement was included the investment in its subsidiaries, PD Genesis Engineering Co., Ltd. amounted to Baht 3.00 million and short-term loans to its subsidiaries amounted to Baht 5.00 million.
In 2010, the Company's cash flow from investing amounted to Baht 17.82 million, mainly from cash paid for purchase of fixed assets amounted to Baht 19.43 million, consisted of a purchase of land and property (including additional section) for Rayong branch amounted to Baht 12.55 million.
In 2011, the Company's cash flow from investing amounted to Baht 8.30 million, mainly from cash paid for purchase of fixed asset amounted to Baht 11.06 million. The main reason for the purchase of water treatment - water recycling equipment as assets under water purchase agreement of Central Group at Chonburi and Khon Kaen amounted to Baht 9.40 million.
Cash flow from financing
In 2009, the Company's cash flow from financing amounted to Baht 92.07 million, mainly from a decrease of overdrafts and short-term loans from financial institutions amounted to Baht 55.51 million, repayment of long-term loans from banks amounted to Baht 13.46 million. Also, the Company had a policy of paying dividend from net profit of 2008 totaled Baht 12.35 million and profit arising from the 2008 operating results amounted to Baht 4.75 million.
In 2010, the Company's cash flow from financing amounted to Baht 58.89 million, mainly from cash received from increasing capital amounted to Baht 137.69 million, a decrease in overdrafts and short-term loans amounted to Baht 42.96 million, cash repayment for long-term loans from banks amounted to Baht 16.08 million, and dividend payment was Baht 36.1 million, consisted of additional dividend payment from profit arising from the 2009 operating results amounted to Baht 7.60 million and interim dividend payment from the profit arising from the first half of the year 2010 and retained earnings amounted to Baht 28.5 million.
In 2011, the Company's cash flow from financing amounted to Baht 50.58 million, mainly from an increase in overdrafts and short-term loans amounted to Baht 24.55 million, repayment of long-term loans from banks amounted to Baht 22.63 million and dividend payment amounted to Baht 47.25 million, comprise of dividend payment from profit arising from the 2010 operating results amounted to Baht 33.75 million which paid in addition to the interim dividend payment of 2010 together with the interim dividend payment from profit arising from the first half of the 2011 operating results and retained earnings amounted to Baht 13.50 million.
Liquidity Ratio
In 2009-2011, the Company's liquidity ratios were 1.31 times, 2.01 times and 1.77 times, respectively.
In 2009, 2010, and 2011, the average collection period was 63 days, 57.66 days and 53.74 days, respectively. In 2009, the average collection period was longer than in 2008 mainly due to some customers who had good payment history but affected by economic slowdown. In 2010, the period was shorter than 2009 due to the customers paid more punctual, following economic recovery and higher proportion of short term payment customers in sales structure.
In 2009, 2010 and 2011, average inventory on hand period was 134.67 days, 107.64 days and 110.92 days, respectively. In 2008, the period was longer 2009 due to a decrease in sales, while there were high inventories. Meanwhile, in 2010, the sales were increasing together with declining of inventories, resulting in shorter average inventory on hand compared with 2009. In 2011, due to the flood crisis in the fourth quarter, the sales was decreased due to some customers were affected by the flooding and currently on recovery period. As the result, the sales order from flood-affected customer segment was decreased.
In 2009, 2010 and 2011, the average payment period was 57.38 days, 52.36 days and 51.88 days, respectively. In 2009, the payment period was declined following the shoes order which received long payment term was slowdown where there had high inventories, coupled with the main supplier decreased the payment term. In 2010, average payment period was slightly decreased when compared to 2009 whereby the proportion of international trading which had longer payment term than domestic trading. In 2011, average payment period increased due to higher proportion of international trading. Domestic and international trade accounts payable were detailed as follow;
| Consolidated Financial Statement | |||
|---|---|---|---|
| December 31, 2010 | December 31, 2011 | ||
| Domestic trade accounts payable | 23,300,596.87 | 17,662,353.95 | |
| Foreign trade accounts payable | 39,631,608.96 | 64,025,061.41 | |
| Total | 62,932,205.83 | 81,687,415.36 | |
| Liquidity ratio | Consolidated Financial Statement | ||
|---|---|---|---|
| 2009 | 2010 | 2011 | |
| Liquidity ratio (times) | 1.31 | 2.01 | 1.77 |
| Current ratio (times) | 0.68 | 0.71 | 0.78 |
| Average collection period | 63 | 57.66 | 53.74 |
| Average payment period | 57.38 | 52.36 | 51.88 |
| Average inventory on hand | 134.67 | 107.64 | 110.92 |
| Cash Conversion Cycle | 140.29 | 112.93 | 112.78 |
Source of Funds
Liabilities
According to equity method, the Company's current liabilities amounted to Baht 154.29 million and non-current liabilities in amount of Baht 39.52 million in 2009.
In 2010, the Company's current liabilities amounted to Baht 158.96 million and non-current liabilities amounted to Baht 41.70 million, when compared to 2009, the borrowings decreased by Baht 34.07 million due mainly to a decrease in overdrafts and short-term loans from financial institutions amounted to Baht 42.99 million. Furthermore, the Company had higher working capital from capital rising activity through public share offering, result in lower demand of overdrafts and short-term loans from financial institutions.
In 2011, the Company's current liabilities amounted to Baht 182.25 million and non-current liabilities amounted to Baht 30.96 million, due mainly to an increase in overdrafts and short-term loans from financial institutions amounted to Baht 24.54 million.
| Borrowings | Consolidated | ||
|---|---|---|---|
| December 31, 2009 | December 31, 2010 | December 31, 2011 | |
| Overdrafts and short-term loans from financial institutions | 56,903,937.53 | 13,917,829.32 | 38,456,221.10 |
| Long-term loans | 38,690,907.76 | 38,856,874.82 | 15,431,971.19 |
| Current portion of long-term loans | 14,042,601.49 | 22,792,958.96 | 23,588,504.73 |
| Total | 109,637,446.78 | 75,567,663.10 | 77,476,697.02 |
In 2009, 2010 and 2011, the Company's debt to equity ratios was 1.18 times, 0.71 times and 0.78 times, respectively. In 2010, the ratio was decreased due to a decrease in liabilities after overdrafts and short-term loans repayment. Meanwhile, equity increased from capital raising activity amounted to Baht 40.00 million and premium on share amounted to Baht 97.69 million. Total liabilities increased from cash received on long-term loans from financial institutions amounted to Baht 25.00 million, accrued dividend amounted to Baht 20.25 million and overdrafts and short-term loans from financial institutions decreased by Baht 42.99 million.
COMMITMENTS AND CONTINGENT LABILITIES
The Company's commitments were letters of guarantee which issued for government agency customer. The outstanding amount of letters of guarantee as of December 31, 2009, 2010 and 2011 are summarized as follow;
| Company | Letter of guarantee outstanding | ||
|---|---|---|---|
| December 31, 2009 | December 31, 2010 | December 31, 2011 | |
| Phol Dhanya Plc. | 2,404,070.50 | 2,667,938.74 | 3.260,212.03 |
The Subsidiary is permitted to utilize the guarantee line of the Company, amounted to Baht 20,000,000 million, approved by the resolutions of Board of Director No. 9/2552 as of November 9, 2010. The Company and its subsidiaries have made a guarantee contract for each others, including Mr. Chavalit Wangthamrong and Mr. Surapol Hungsapruek, the directors of its subsidiaries, had also entered into the guarantee contract which signing on September 15, 2010. As of December 31, 2011, the Subsidiary had no remaining letters of guarantee.
Equity
According to the consolidated financial statement in 2009, the Company's equity amounted to Baht 164.10 million, an increase of profit arising from the 2009 operating results amounted to Baht 17.61 million. In addition, the Company had dividend payment from profit arising from the 2008 operating results amounted to Baht 12.35 million and profit arising from the first half of the 2009 operating results amounted to Baht 4.75 million.
In 2010, the Company's equity amounted to Baht 283.20 million, mainly from issuance of common share offering amounted to Baht 40 million and share premium amounted to Baht 97.69 million. In addition, the Company had dividend payment from profit arising from the second half of the 2009 operating results amounted to Baht 7.60 million, and paid interim dividend from profit arising from the first half of the 2010 operating results amounted to Baht 7.60 million and retained earnings amounted to Baht 20.90 million. In 2010, the Company's operating profit amounted to Baht 37.76 million.
In 2011, the Company's equity amounted to Baht 270.07 million, a decrease due to adjusting commitments of employee benefits amounted to Baht 12.71 million and retained earnings. In addition, the Company had dividend payment from profit arising from the second half of the 2010 operating results amounted to Baht 13.50 million, and paid interim dividend from profit arising from the first half of the 2011 operating results amounted to Baht 13.50 million. In 2011, the Company's operating profits amounted to Baht 25.18 million.
The External Auditor's Fee
- Audit FeeIn 2008, the Company has paid the audit fee to Mrs. Suvanee Kittipanyangam, Certified Public Accountant No. 2899 of Banchikij Co., Ltd. in amount of Baht 790,000 and Baht 820,000 in 2009.
In 2010, the Company has paid the audit fee to Mr. Athipong Athipongsakul, Certified Public Accountant N0. 3500 of ANS Audit Co., Ltd. was Baht 635,000. In 2011, the Company has paid the audit fee to Mr. Sathien Vongsnan, Certified Public Accountant No. 3495 in amount of Baht 805,000 which including the audit fee of its subsidiaries in amount of Baht 225,000. - Non Audit Fee-None-
Factors that may have an effect on the operating results or financial position in the future
-None-